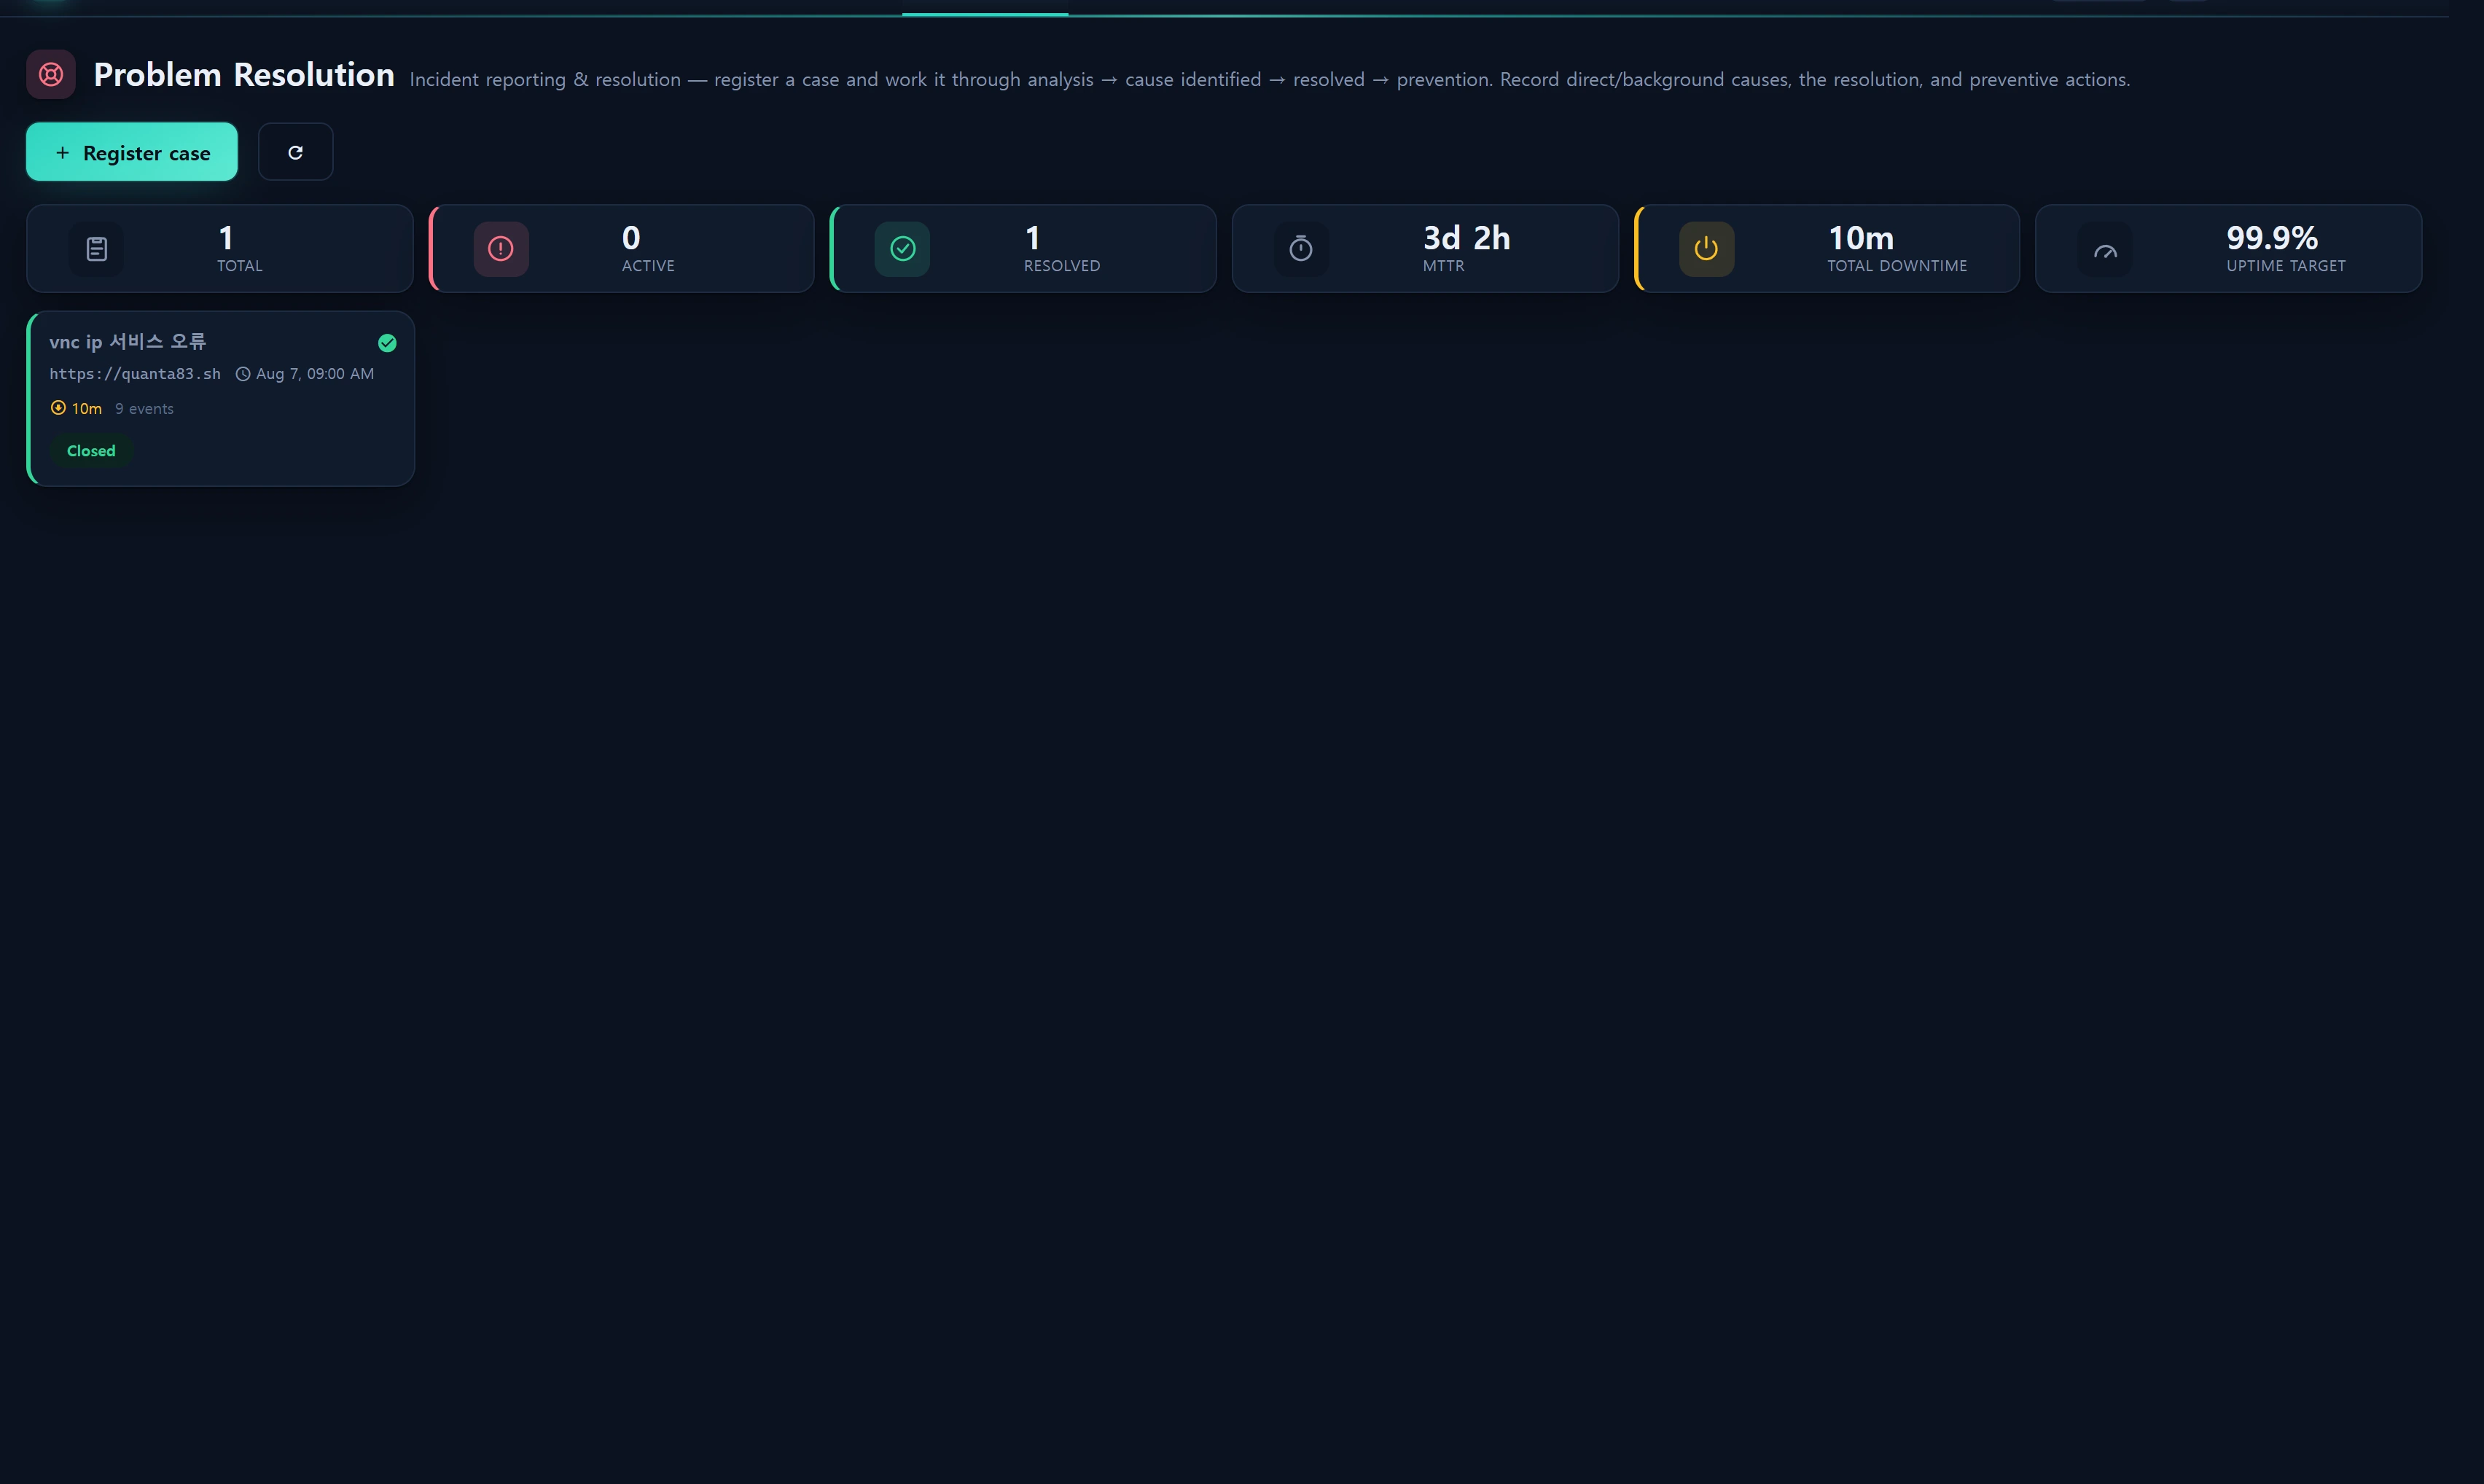
Overview — what it does
Problem Resolution is the incident case workflow for the Service role area. Register any outage, error, or degradation as a single case and drive it through the status pipeline register → investigating → cause identified → resolved → closed, capturing investigation, cause, and action at each step. It doubles as your post-mortem and preventive-action ledger.
All data lives in one table, infr_incident, and this screen handles only rows where area='service'. The Security Problem Resolution screen shares the same table with area='security' — identical schema, separate board.
Each case carries four cause/action fields modeled on a formal post-mortem report:
| Field | Meaning | Example |
|---|---|---|
direct_cause |
The surface trigger of the outage | mysql connection limit exceeded (Too many connections) |
root_cause |
The underlying reason that produced the surface cause | a 5-minute cron script never returned connections → leak → limit exhausted |
resolution |
Action that restored service during the incident | cleared connections, restarted process, raised the limit for immediate recovery |
action_taken |
Permanent fix to prevent recurrence | isolated dedicated account with MAX_USER_CONNECTIONS, patched the script, added a monitoring alert |
This screen was renamed from the former "SLA & Uptime" menu (namespace
sla→resolution). The uptime-target KPI (uptime_target) is retained.
When to use
- Post-incident write-up: after a service goes down and recovers, record cause, fix, and prevention as a reusable retrospective.
- Recurrence tracking: confirm whether the same error keeps happening and whether the root cause was actually removed.
- MTTR & downtime management: manage mean time to resolve and cumulative downtime as metrics and compare against your uptime target.
- Handling the auto-intake queue: when external apps push errors via the Pulse/exception reporter, those land as
source='pulse'cases here for a human to triage and resolve.
Layout
KPI strip
The top KPIs are computed across all area='service' cases.
| KPI | How it is computed |
|---|---|
Total (total) |
Count of service cases |
Active (active) |
Sum of open + investigating + cause_identified |
Resolved (resolved) |
Sum of resolved + closed |
MTTR (mttr_min) |
Average of (resolved − occurred) in minutes, only for cases that have BOTH occurred_at and resolved_at |
Cumulative downtime (downtime_min) |
Plain sum of each case's downtime_min field (minutes) |
Uptime target (uptime_target) |
Operations Policy sla_uptime_target (default 99.9%) |
To get accurate MTTR, enter an occurred-at time (
occurred_at) on the case and let the transition to Resolved stampresolved_atautomatically. A case with no occurred-at is excluded from the MTTR average.
Case board
Cases are listed as cards/rows, sorted server-side (PHP, to avoid raw SQL in the controller) by this priority:
- Status rank:
open→investigating→cause_identified→resolved→closed - Severity rank:
crit→warn→info - Newest id first
So active, severe, recent cases float to the top.
Each card shows the source badge (manual / Pulse / alert / agency / quarantine / detection-promoted), severity, status, project name, occurred time, downtime, and event count.
Detail modal
Opening a case shows the Report on the left (summary · direct cause · root cause · resolution · preventive action) and the Timeline on the right (status changes · notes), with pipeline transition buttons at the top.
How to use
1) Register a case
[Register case] → modal form. On create the case is stored with source='manual', area='service', status='open'; detected_at is stamped server-side (now()) and a created event is appended to the timeline.
Fields and validation limits:
| Field | Required | Limit |
|---|---|---|
title |
✔ | max 200 chars |
severity |
info/warn/crit — empty defaults to warn (Operations Policy incident_default_severity) |
|
project_id |
must exist in infr_project |
|
service_id |
must exist in infr_service |
|
url |
max 255 chars | |
occurred_at |
date | |
summary |
max 4000 chars | |
direct_cause / root_cause / resolution / action_taken |
max 4000 chars each | |
downtime_min |
integer, ≥ 0 | |
impact |
max 191 chars |
2) Status transition (pipeline)
In the detail modal, clicking a next-step button opens a step transition dialog. Each step explains "what to do in this step" and lets you fill in the report fields relevant to that step. Only the fields you send are updated, so you can enrich causes without changing status, or beef up the report only.
| Step | Code | What to do in this step |
|---|---|---|
| Register | open |
Return the case to intake (before investigation) |
| Investigating | investigating |
Confirm symptoms, scope the impact, write the summary |
| Cause identified | cause_identified |
Determine and record the direct cause and its root (background) cause |
| Resolved | resolved |
Record the recovery method applied and the preventive action |
| Closed | closed |
Verify the fix and prevention are in place, then close the case |
Transition rules:
- Moving to
resolvedstampsresolved_atwithnow()if it is empty (the MTTR basis). - Moving to
closedlets you enter a closed-at time (closed_at) manually via the same flatpickr picker used for occurred-at. If you provide a value it is used; if left blank (and not already set) the server usesnow(). - If the status actually changes (
from !== to), astatus_changeevent is appended; if you also enter a note in the dialog, anoteevent is added too.
Dates render via
toLocaleStringbound to the active UI locale (window.__locale), so month/time display correctly even in EN mode.
3) Collaboration notes
Adding a note in the detail modal appends a kind='note' event to the timeline (notes are consolidated into infr_incident_event — there is no separate note table). Body max 4000 chars.
4) Delete
Deleting a case removes the incident and all its linked infr_incident_event rows together. This cannot be undone.
5) Auto-intake (Pulse / exception reporter)
When an external Laravel app pushes its exceptions to the incident ingestion API (POST /api/v1/incidents), IncidentIngestService handles them and auto-enters them on this board:
- Fingerprint dedup: if the same error already exists in an open state (
open/investigating/cause_identified), no new case is created — onlyoccurrence_countis incremented. Resolved/closed cases are reopened as new. - New cases are created with
source='pulse',status='open',entity_type='exception'(withareaunset → the migration defaultservice→ visible on this board), and acreatedevent is appended. - Recurrence notes are throttled to once per 300 seconds so the timeline does not flood.
- The payload
level(error/warning/critical…) is mapped to severity (warn/crit…); if an incoming severity is higher than the existing one, the case is escalated.
Keys and integration code are managed in Administration ▸ API Keys.
Data sources
| Table | Role |
|---|---|
infr_incident |
The case itself. This screen queries only area='service'. Migration 000719 (+ 000723 ingest fields · 000731 area · 000732 source expansion) |
infr_incident_event |
Timeline (append-only). kind = created/note/action/status_change/cause/resolution/alert_added. Uses created_at only (migration 000720) |
infr_project |
Project dropdown · card project name |
infr_service |
Service dropdown |
infr_audit_log |
Audit trail for create/update/transition/delete |
Key infr_incident columns: source, area, title, severity, status, project_id, service_id, url, occurred_at, detected_at, resolved_at, closed_at, summary, direct_cause, root_cause, resolution, action_taken, downtime_min, impact, fingerprint, occurrence_count, last_occurred_at, api_key_id, created_by, updated_by.
Defaults come from Operations Policy OpsPolicy::slaDefaults():
sla_uptime_target         = 99.9   # SLA target uptime (%)
incident_default_severity = warn   # default severity on register (info|warn|crit)
Routes:
GET  /service/resolution              index (board)
GET  /service/resolution/live         live  (JSON polling refresh)
POST /service/resolution/save         register / update a case
POST /service/resolution/transition   status transition (+ per-step report / closed_at)
POST /service/resolution/note         add a collaboration note
POST /service/resolution/delete       delete a case
Access
| Action | Required level |
|---|---|
View board (index/live) |
Authenticated user (infr.auth, level ≥ 1) |
| Register / update / transition / note / delete | level ≥ 2 |
- demo (1) — read-only. Any write attempt returns 403 (
resolution.err.forbidden, "no permission — level 2+ required"). - staff (5) · admin (10) — full CRUD and transitions.
Every write (register/update/transition/delete) is recorded in infr_audit_log as incident.create / incident.update / incident.transition / incident.delete, capturing the actor and before/after status. See RBAC levels for the level model.
Troubleshooting & FAQ
Q. MTTR shows blank / no value.
A case must have BOTH an occurred-at time (occurred_at) and a resolved-at time (resolved_at) to be included in the MTTR average. Confirm you entered occurred-at and that transitioning to Resolved stamped resolved_at.
Q. Cumulative downtime shows 0.
The downtime KPI is a plain sum of each case's downtime_min field. You must enter downtime (minutes) on the case; it is not auto-derived from occurred/resolved times.
Q. A Pulse case is not showing up.
Ingested cases have source='pulse' and leave area unset, so they default to service and appear here. If one is still missing, check whether (1) the API key is valid, and (2) the same fingerprint was deduped into an already-open case (only occurrence_count incremented). Security incidents appear on Security Problem Resolution (area='security'), not this board.
Q. Can I set the closed time in the past?
Yes. Enter the desired time in the closed-at (flatpickr) field of the closed transition dialog and that value is saved. Leave it blank to use the server's current time (now()).
Q. I want to enrich causes without changing status. The transition dialog updates only the fields you send. Transitioning to the same status while filling report fields updates the report without a status-change event (or edit the case directly).
Q. Can a deleted case be restored? No. Delete removes the case and all its timeline events and cannot be undone. The delete action itself is recorded in the audit log.
Related
- Security Problem Resolution — mirror board sharing the same
infr_incidenttable witharea='security'. - Incident ingestion API · API keys — auto-enter external app errors as
source='pulse'cases. - Projects — the project registry you link cases to.
- Service Overview — live service ops (feeds the unresolved-incident KPI).
- Observability (Pulse/Horizon) — background on the exception collection pipeline.