Overview — what it does
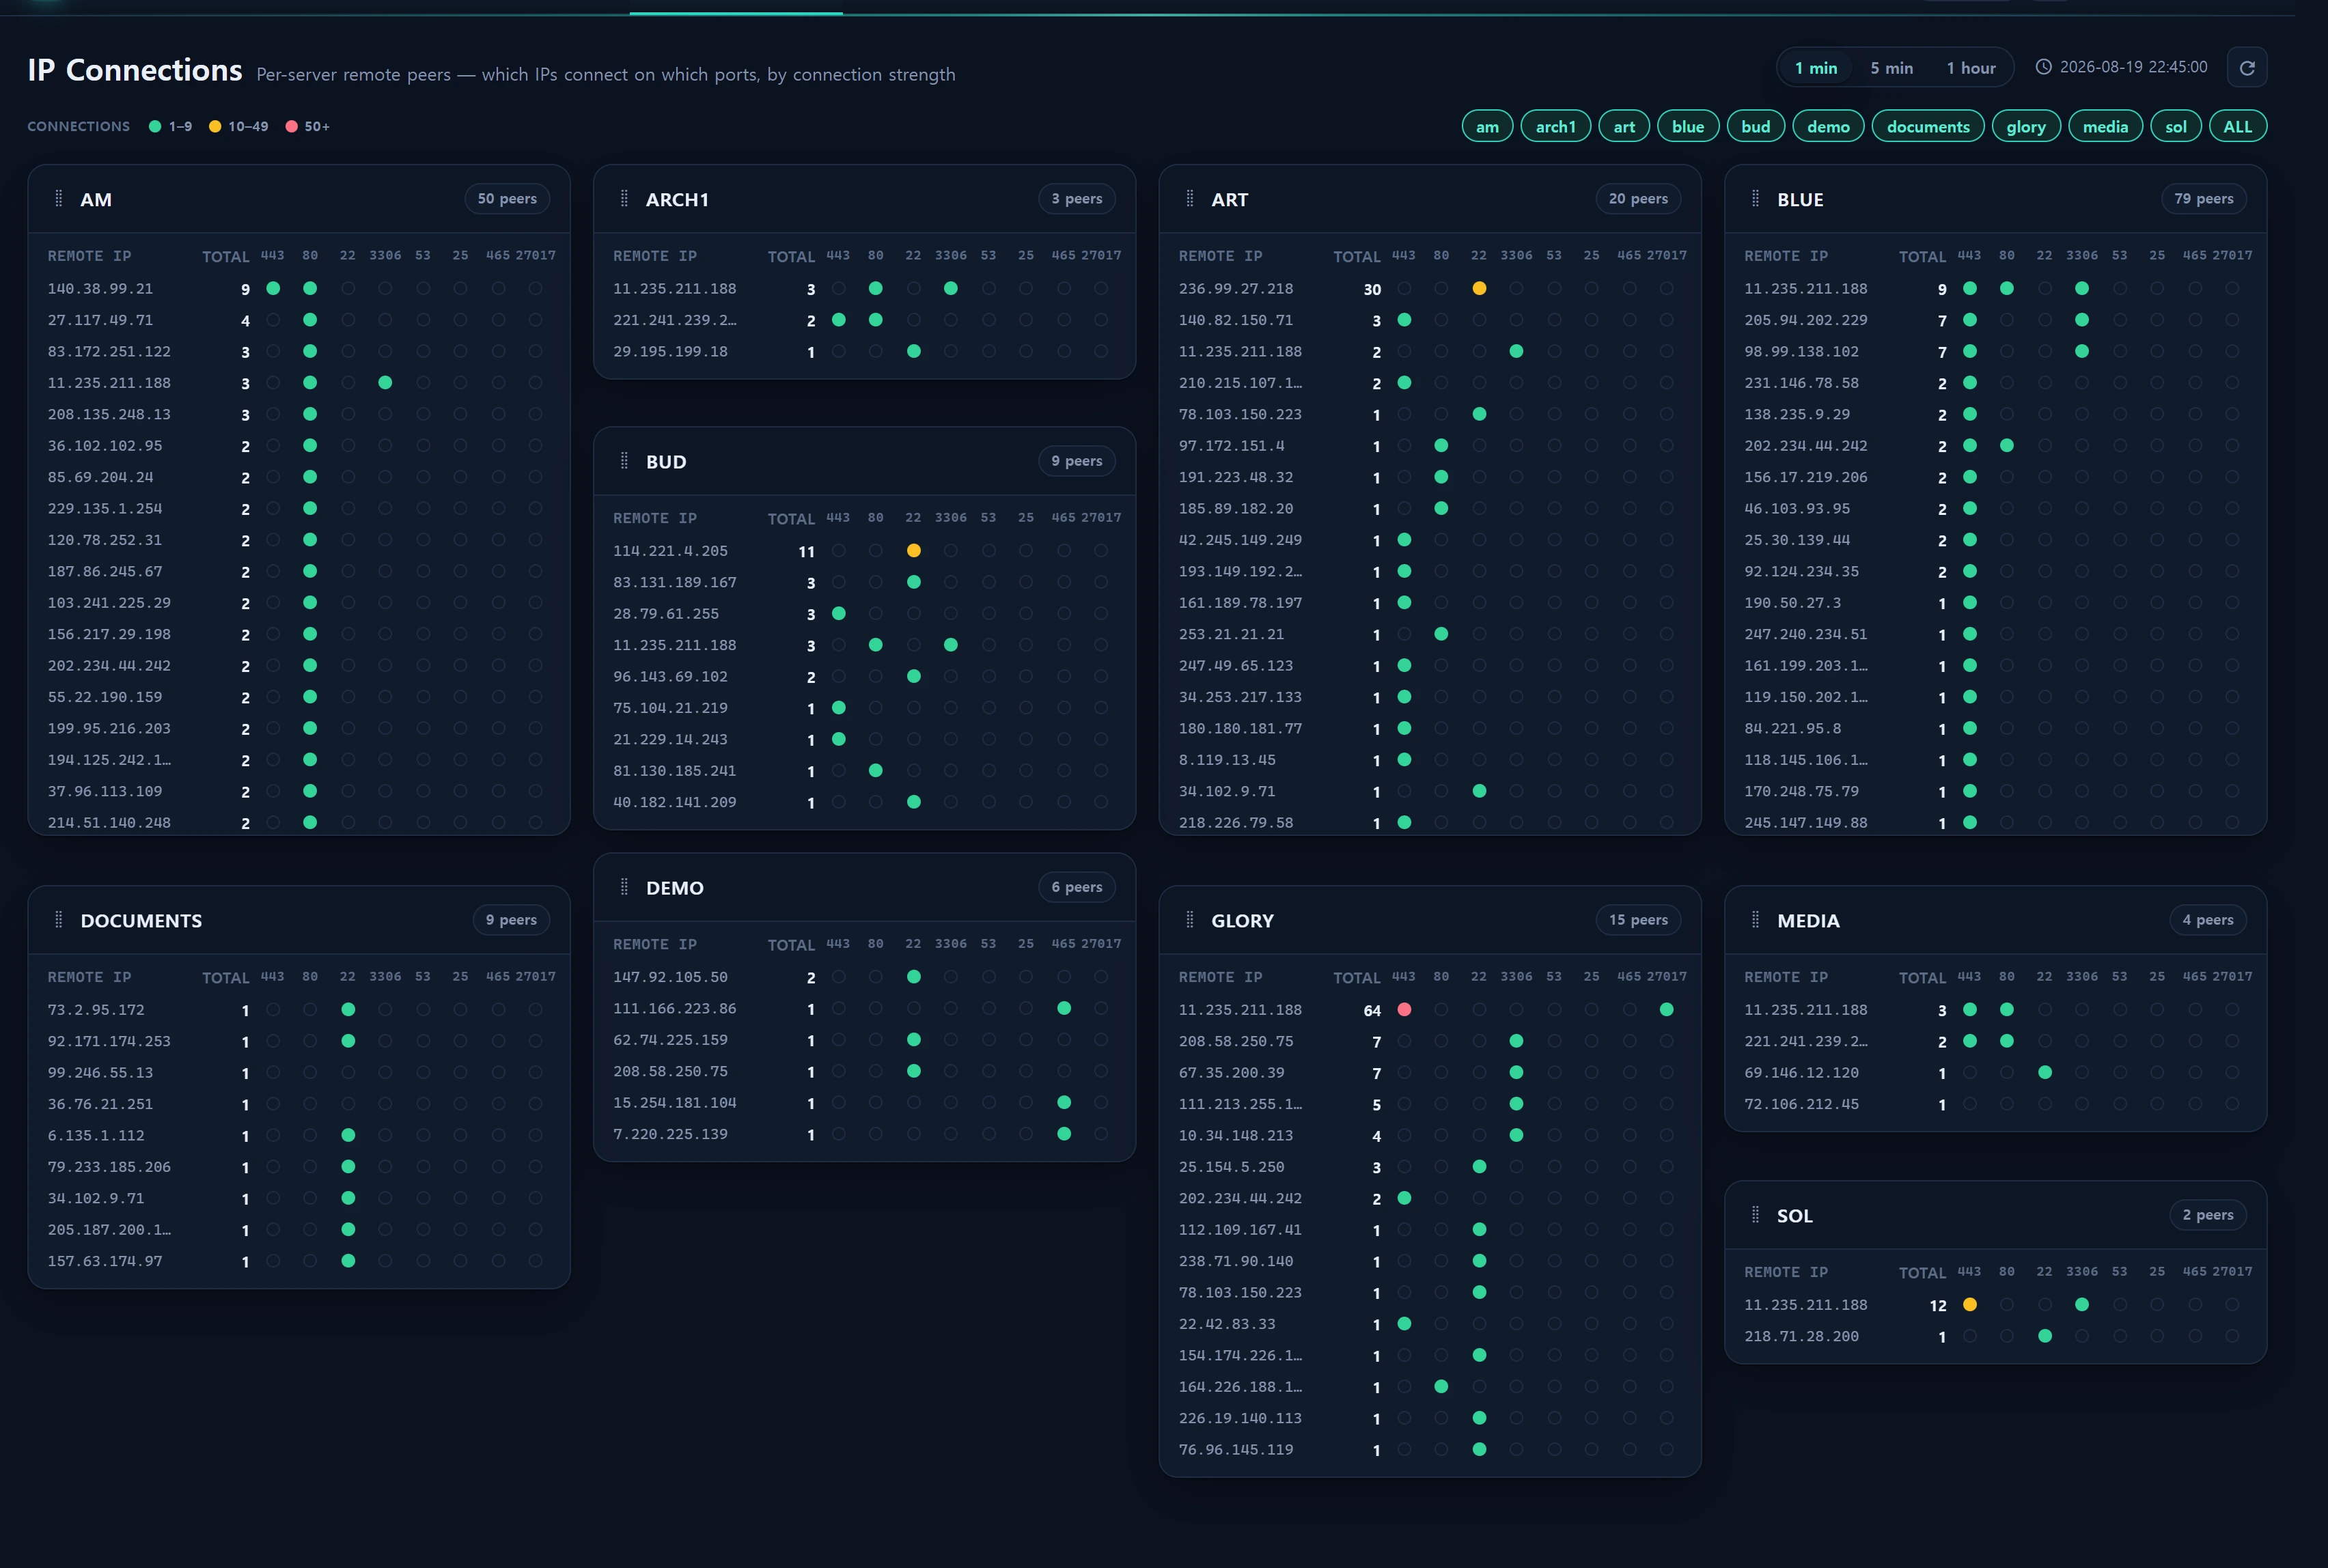
IP Connections is the second screen of Infrastructure ▸ Connectivity & Traffic (the host view). Where Port Connections pivots on "port → server", this screen pivots on "server (host) → remote peer IP". Each server card lists the remote IPs currently connected to that server, ranked by connection strength, and shows a per-monitored-port session-strength dot for every IP. The goal is to see at a glance which IP hits which server on which port, and how hard.
Clicking a peer IP opens the shared IP investigation popup, where you can examine that IP's connection breakdown (which server / port / TCP state / session count), a rollup connection-history sparkline, geo/ASN/ISP enrichment, an external reputation link, and a block deeplink into the Blocklist — all in one place.
- Routes:
/infra/traffic/ips(page) ·/infra/traffic/ips/live(polling JSON) ·/infra/traffic/ip-detail(investigation JSON) - Controller:
App\Http\Controllers\Infra\TrafficController@ips - Builder:
App\Services\Traffic\SessionQueryService::ipsData()+ipDetail() - Source queries:
App\Repositories\TrafficRepository(legacylegacy_gloryconnection, read-only) - Source tables:
traffic_session_ct(+ rollupstraffic_session_ct_5min/_1hour/_1day, enrichmentip_info_loop)
All data is read read-only from the legacy traffic DB (
legacy_glory). This screen never writes anything — write actions such as blocking are handed off via a popup deeplink to the Blocklist screen, where the write happens.
When to use
- Detect a server drawing an abnormal number of remote peers (scanning, botnets, crawler floods).
- Catch lateral-spread patterns where one IP hits several servers/ports at once.
- Trace an IP surfaced by an IDS/firewall alert back from the traffic angle (which server, port, and state actually had sessions).
- Verify an IP's connection volume, history, geo, and reputation before deciding to block.
- Deep-dive a source IP arriving from the SRC circle on Port Connections.
Layout
Hero · timer
The top-right holds the timer toggle (1 min / 5 min / 1 hour) that sets the display window, the latest snapshot timestamp, and a manual refresh button. The timer is the length of the query window anchored to the latest snapshot.
| timer | Query window |
|---|---|
1 (default) |
The single latest snapshot minute |
5 |
Last 5 minutes from the latest snapshot |
60 |
Last 60 minutes from the latest snapshot |
The chosen timer persists to localStorage['infr:timer:traffic-ips'] across visits. Only 1/5/60 are allowed; anything else is coerced to 1.
Strength legend + server chips
- Strength legend: dot color encodes the per-port session-count bucket —
1–9(good) ·10–49(warn) ·50+(crit). - Server chips: a filter for which servers (hosts) to show. The default is all selected, and the chip filter is session-only (not persisted to localStorage), so a fresh visit returns to all. The
[All]chip toggles select-all / clear.
Server (host) cards
One card per selected server. The header shows the hostname and the peer count; the body is a table.
- Row (peer) = one remote IP. Columns:
Remote IP·Total(total sessions) · then a per-monitored-port strength dot (first 8 monitored ports). - Peers are sorted by total connection (session) count, descending, and up to 100 peers are shown per server.
- Strength dots encode how many sessions that peer holds on each port by color (see table).
- Clicking a row opens the investigation popup for that IP.
Cards are drag-reorderable via the grip (order persists to infr:order:traffic-ips), re-flowed with row-span masonry, and paginated 20 at a time.
Port strength dot colors
| Sessions | Token | Color | Meaning |
|---|---|---|---|
0 |
none | faint | Not connected on this port |
1–9 |
good | green | Low strength |
10–49 |
warn | amber | Medium strength |
50+ |
crit | red | High strength |
IP investigation popup
Driven by the shared mixin mixins/ip_detail.js + partial infra/partials/ip-detail-modal.blade.php. It has two modes.
- sources mode — the list of source IPs in a (server, port) window. Entered from the SRC circle on Port Connections.
- investigate mode (this screen's default entry) — a single-IP deep dive. Entered by clicking a peer row.
What investigate mode shows:
| Area | Content | Source |
|---|---|---|
| Summary KPI | Total sessions · server count · port count · first/last seen | ipSeenSpan() (full-retention MIN/MAX(created_at)) |
| Geo | Country · city · ASN · ISP | ip_info_loop (ipEnrichment()) |
| Connection history | grain (5min / 1hour / 1day) sparkline | rollup tables (ipHistory()) |
| Connection breakdown | Server × port × TCP state sessions · remote ports · first/last | traffic_session_ct (ipBreakdown()) |
Popup footer actions (investigate): Copy IP · View IP (re-investigate on this page via ?src_ip=) · Reputation ↗ (external AbuseIPDB, new tab) · Block IP (deeplink to Blocklist via ?add=).
The popup's Reputation ↗ button is a plain link that opens the external
abuseipdb.com/check/…in a new tab. The in-app reputation popup that shows a confidence gauge and report history inside the console is a Security-screen feature — see IP Reputation.
How to use
Basic flow
- Set the window (1/5/60 min) with timer. Shorter is closer to "connected right now".
- Narrow to the servers you care about with server chips (all by default).
- On a server card, look for peers with a red strength dot (50+ sessions) or peers spanning multiple ports.
- Click the suspect peer row to open the investigation popup.
- In the popup use the connection breakdown to see which server/port/state it hit, the history to gauge persistence (one-off vs recurring), and geo/ASN for origin.
- If needed, check external report history via Reputation ↗, and if malicious hand it to the Blocklist with Block IP.
Switching history grain
Switching grain in the popup's history section changes the rollup table. The default grain is hourly (1hour) — the best density/speed balance.
5min    → traffic_session_ct_5min   · individual IP · latest-snapshot −6h window
1hour   → traffic_session_ct_1hour  · individual IP · latest-snapshot −3d window   (default)
1day    → traffic_session_ct_1day   · /24 block     · latest-snapshot −120d window
Daily (
1day) history is aggregated by the IP's /24 block (first 3 octets, 256 IPs), not the individual IP — because the rollup collector stores_1dayby C-class. The popup then displays a CIDR scope label such as211.224.128.0/24to make the scope explicit. 5min and 1hour use the individual IP as-is.
Deeplinks
?src_ip=203.0.113.10— on page load, auto-opens the investigation popup for that IP (used when arriving from another screen or an alert).?alias=…/?servers=…/?server=…— pre-applies the server-chip filter (comma/space separated, case-insensitive match). Applies to this visit only; not persisted.
/infra/traffic/ips?src_ip=203.0.113.10
/infra/traffic/ips?servers=glory,blue
Polling
The page polls /infra/traffic/ips/live every 30 seconds to auto-refresh (not Reverb — the collector writes to the DB outside Laravel, so polling is the sensible choice). On refresh, if all were selected it auto-includes newly appearing servers, and drops servers that vanished from the selection.
Data sources
Window anchoring
The display window is anchored to the data's latest snapshot (MAX(snapshot_ts)), not the app's now(). The collector's storage clock can drift up to ~9 hours behind the app clock, so a now()-based window would fall outside the data and render empty.
Host view query (ipPeers)
-- TrafficRepository::ipPeers (parameter-bound)
SELECT server_name, remote_ip, local_port, SUM(session_count) AS total_sessions
  FROM traffic_session_ct
 WHERE snapshot_ts BETWEEN :min AND :max
   AND local_port IN (:ports)          -- OpsPolicy::monitoredPorts()
 GROUP BY server_name, remote_ip, local_port;
The monitored ports are not hardcoded — they come from infra_monitored_ports (CSV) in Operations Policy. The ipsData() result is cached for 20 seconds (key infr:traffic:ips:v1:{timer}:{ports}).
Investigation popup queries
| Method | Table | What it does |
|---|---|---|
ipSeenSpan() |
traffic_session_ct |
MIN/MAX(created_at) = true observation span (≈8h retention), MAX(snapshot_ts) = the IP's own latest batch (breakdown anchor) |
ipBreakdown() |
traffic_session_ct |
Per server×port×state session sums · remote ports · first/last (LIMIT 200) |
ipHistory() |
3 rollups | Session history per grain (LIMIT 400) |
ipEnrichment() |
ip_info_loop |
Country · city · ASN · ISP (graceful null if absent) |
The connection breakdown is anchored to the IP's own latest snapshot batch, not the global latest window. This is deliberate so an IP that isn't connected right now but hit us in the past still shows its distribution, reconstructed from its last observed moment.
Rollup index caveat (performance-critical)
ipHistory() always specifies direction IN ('inbound','outbound').
-- _1day uses the composite index t_ip(direction, remote_ip).
-- Without an explicit direction it scans the created_at range only → 12s+.
-- With it, the index engages → ~20ms (measured 2026-08-06).
SELECT created_at, SUM(session_count) AS sessions
  FROM traffic_session_ct_1day
 WHERE direction IN ('inbound','outbound')
   AND remote_ip = :cclass_key           -- daily uses the /24 first-3-octet key
   AND created_at >= :since
 GROUP BY created_at
 ORDER BY created_at
 LIMIT 400;
The rollups are huge (_5min ≈ 209M · _1hour ≈ 112M · _1day ≈ 24M), so a tight created_at >= window + LIMIT is mandatory. Popup results are protected by caches: investigate 25s, sources 20s.
Access
- This screen belongs to the Infrastructure role area (minimum
user_level1) — it is read-only, so any logged-in user (demo=1) can view it. - The page,
/live, and/ip-detailall sit underinfr.auth(login) with no extra level gate. - There are no writes here. The popup's Block IP is a deeplink to the Blocklist screen; the actual block (a
blacklist_infowrite) is performed there withuser_level≥ 2 plus an audit log.
Troubleshooting & FAQ
Cards are empty and only "no peers in this window" shows.
It means the latest snapshot has no connections on the monitored ports. (1) Widen timer to 5 or 60, (2) confirm real service ports are registered in Operations Policy infra_monitored_ports, and (3) check that recent snapshots are landing in traffic_session_ct (collector check_ct.js).
Everything is empty and there is no snapshot timestamp.
Likely the legacy_glory connection or traffic_session_ct itself is empty. Verify the legacy_glory DB credentials in .env and that the traffic collector is running. On a query failure the payload carries error:true.
Only the daily history shows "no daily rollup history for this /24 block". Daily aggregation can lag by a day and is keyed by the /24 block. Check the 5min and hourly grains first. If the block has no rollup yet, this is expected.
I clicked an IP but the connection breakdown is empty. That IP has no sessions in the recent snapshot but has past observations. Use the summary KPI first/last seen and the connection history to confirm past activity (the breakdown reconstructs from the IP's last snapshot batch).
The popup's "Reputation ↗" opens a new tab instead of showing inline. That is intended. This traffic popup uses an external AbuseIPDB link. To see the confidence gauge and report history inside the console, use the Security screens' in-app reputation popup.
What drives the strength dot colors? The per-port session-count bucket — 1–9 green · 10–49 amber · 50+ red · 0 is a faint dot. Only the first 8 monitored ports are shown as columns.
Related
- Port Connections — the port → server PORT OVERVIEW (state bars, SRC circle)
- Traffic (network I/O) — per-server in/out bytes and packet throughput
- Blocklist & Reputation — the destination of the popup "Block IP" deeplink (write + audit)
- IP Reputation — the in-console AbuseIPDB confidence-gauge popup
- Operations Policy — configure monitored ports (
infra_monitored_ports) - Alerts — dispatch SMS/email to owners on threshold breach