Overview — what it does
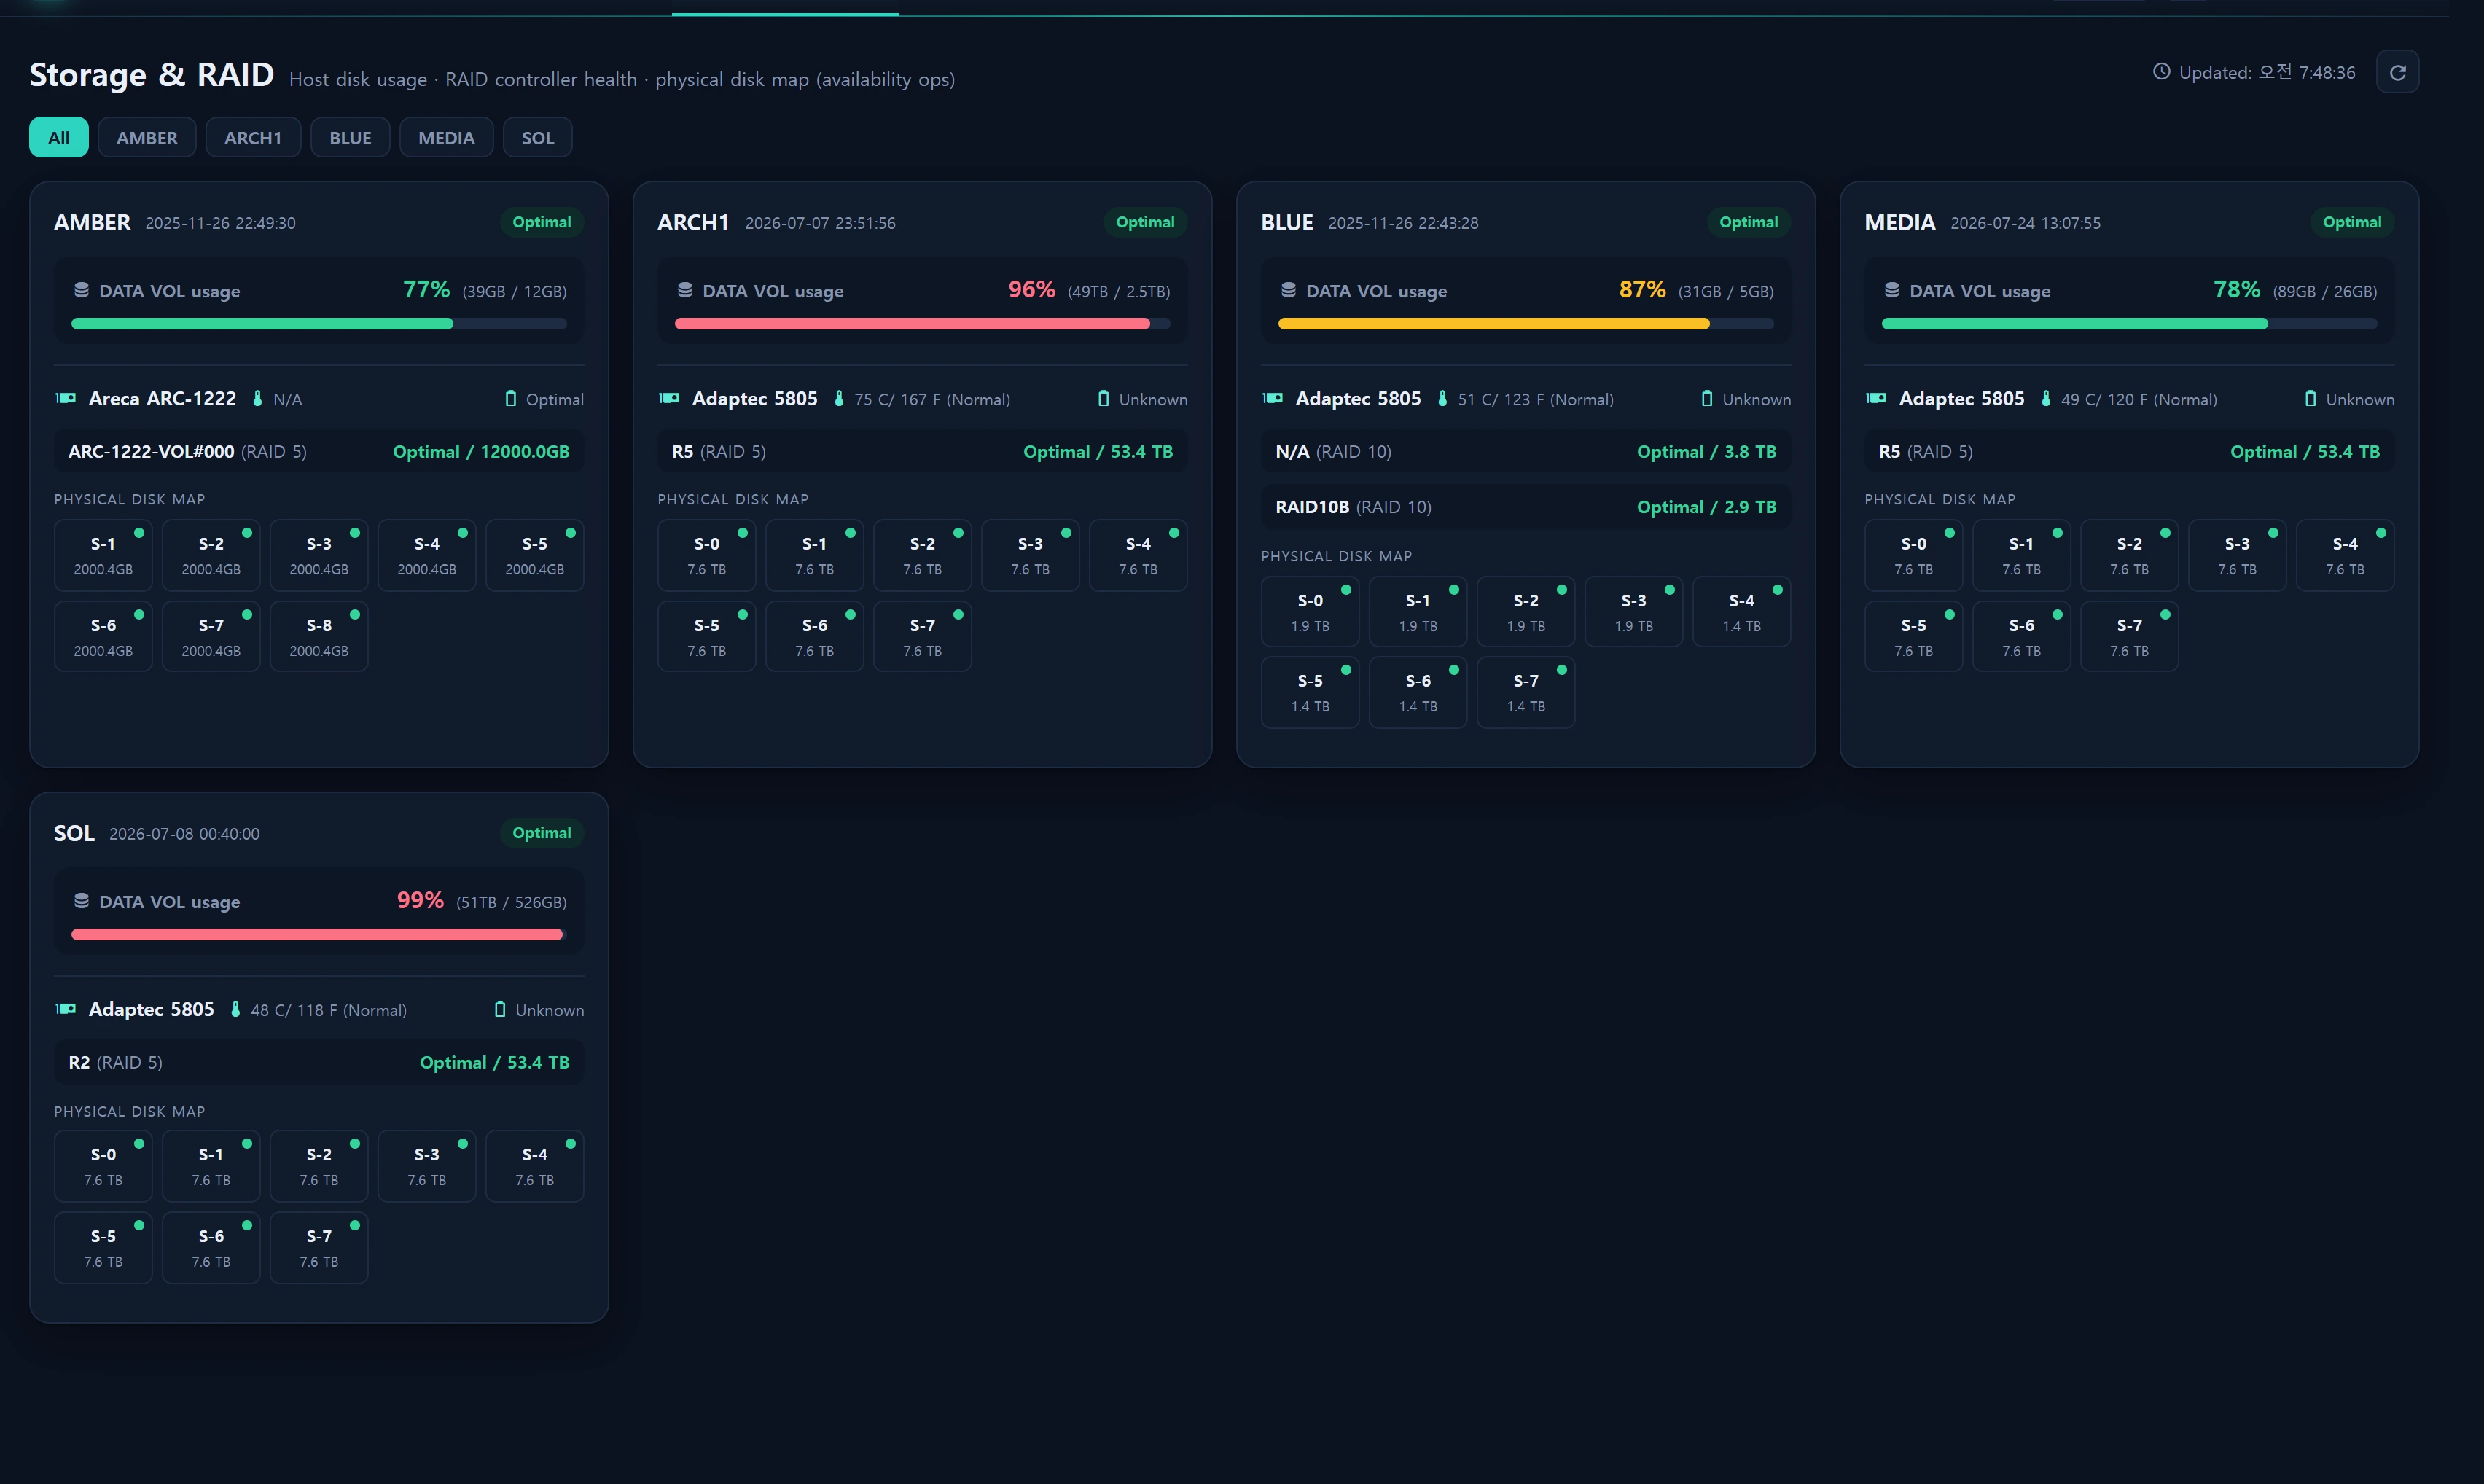
Infrastructure ▸ Storage & RAID (/infra/storage) is a read-only availability dashboard that gathers each host's storage health onto one screen. It assembles two kinds of telemetry into cards.
- RAID controller health — from legacy
storage_status.json_data(the output of Adaptecarcconfcollection): controller status (Optimal/Degraded/Failed), temperature, battery status, logical volumes (RAID level · status · size), and a physical disk map (per-slot status · model · serial · size). - Data-volume disk usage — from the
df-*snapshot in legacyserver_status: data-volume usage percent · used · available, shown at the top of the card.
The core purpose is early disk-failure warning. When a RAID array drops to Degraded or a physical disk goes Failed/Missing, the color (amber/red) makes it immediately visible so you can replace and rebuild before a second disk dies and the whole array collapses.
This screen covers live status (health right now) only. The storage asset registry (device metadata, capacity planning, file-area tree) is owned by Assets ▸ Storage & Files. The two are intentionally separated (see Data sources).
When to use
- During routine rounds, to see every node's RAID status at a glance.
- When a server is sluggish or you get I/O warnings, to quickly triage free disk space and array state.
- Before/after a disk swap, to visually confirm rebuild progress/completion via the slot map.
- When a disk-free-space alert fires in Infrastructure ▸ Alerts and you need to drill into which volume is affected.
Layout
Hero · control bar
- Title/subtitle + refreshed-at timestamp (
Updated: HH:MM:SS) + refresh button (manual poll). - Host filter bar —
Allplus one button per host. Selecting a host filters to it and resets to page 1.
Storage card
One card is rendered per host.
| Region | Content |
|---|---|
| Header | Host name · last-updated time · RAID summary badge (status_summary) |
| Usage | DATA VOL usage label + percent + (used / available) + track bar |
| Controller | Icon + model · temperature · battery status |
| Logical volume | name (RAID level) + status / size |
| Physical disk map | Slot chips (S-{slot} + size), color per status, tooltip = model · serial · status |
If there is no controller info, the card shows No controller data; if there are no cards at all, it shows No storage data. The list pages at 10 per page.
Status color rules
RAID summary · logical-volume status (raid_tone):
| Contains | Color | Meaning |
|---|---|---|
optimal |
good (green) | Healthy |
degrad |
warn (amber) | Degraded — one disk failed, rebuild needed |
fail |
crit (red) | RAID failed — data at risk |
| other | muted (gray) | Unknown |
Physical disk status (disk_tone):
| Contains | Color | Meaning |
|---|---|---|
online / optimal |
good | Healthy |
rebuild |
warn | Rebuild in progress |
fail / missing |
crit | Failed / dropped |
| other | muted | Unknown |
Disk usage (usage_tone):
| Usage | Color |
|---|---|
| ≥ 95% | crit |
| ≥ 80% | warn |
| < 80% | good |
How to use
- Open Infrastructure ▸ Storage & RAID from the menu.
- Use the host filter at the top to focus on one server or view
All. - Scan the header RAID badge on each card first; prioritize amber/red cards.
- On a problem card, read the physical disk map to find which slot is
Failed/Missing/Rebuild. Hover a chip for the model and serial tooltip. - Check the usage bar to see whether the data volume is approaching the 80%/95% thresholds.
- If the data looks stale, click Refresh at the top right.
This page does not auto-poll. Displayed data passes through a server-side 30-second cache, and the screen only updates when you press the refresh button (which re-queries
/infra/storage/live). When leaving it open to watch trends, press refresh periodically.
Data sources
Both tables come from legacy MySQL (the legacy connection, read-only). The app never writes them.
| Table | What | Supplier |
|---|---|---|
storage_status |
host, status_summary, json_data (controllers/logical_volumes/disks), created_at |
sync_adp.js (Adaptec arcconf) |
server_status |
df-* part snapshot → disk usage |
run_report.js |
json_data shape (example)
{
  "controllers": [
    {
      "model": "Adaptec ASR-5805",
      "temperature": "41C",
      "battery_status": "Optimal",
      "status": "Optimal",
      "logical_volumes": [
        { "name": "Data", "raid_level": "6", "status": "Optimal", "size": "10.9TB" }
      ],
      "disks": [
        { "slot": 0, "status": "Online", "model": "ST4000NM0033", "serial": "Z1Z00000", "size": "3.6TB" }
      ]
    }
  ]
}
df-* value shape
server_status.value is JSON carrying p (percent) · u (used) · a (available).
{ "p": 72, "u": "7.2T", "a": "2.8T" }
Host ↔ alias mapping
Usage is joined via a static map from storage_status.host (uppercase label) to server_status.server_alias (lowercase). Hosts absent from the map fall back to a lowercased host name.
| host | alias | host | alias | |
|---|---|---|---|---|
| AMBER | am | ART | art | |
| MEDIA | media | BUD | bud | |
| ARCH1 | arch1 | GLORY | glory | |
| SOL | sol | DOCU | documents | |
| BLUE | blue | DNS_SERVER | demo |
seq-window query — avoiding slow scans
server_status is a large time series. Aggregating the whole table with MAX(seq) … GROUP BY server_alias, part triggers a full scan. Instead the builder (StorageStatusService::dfUsageByAlias) pulls only the 3 most recent seq values via the index, then reads just the df-* rows in those seqs.
-- 1) The 3 most recent seq values (seq index → O(log N))
SELECT DISTINCT seq FROM server_status ORDER BY seq DESC LIMIT 3;

-- 2) Only df-* rows within those seqs (oldest→newest, newest wins)
SELECT server_alias, part, value
  FROM server_status
 WHERE seq IN (?, ?, ?) AND part LIKE 'df-%'
 ORDER BY seq;
Per alias it prefers the df-data part; if absent, it uses the volume with the highest usage (p max) as the representative value.
The latest RAID rows are likewise narrowed to the newest per host.
SELECT MAX(id) AS mid FROM storage_status GROUP BY host;   -- latest per host
SELECT * FROM storage_status WHERE id IN (?, ...) ORDER BY host;
Results are cached for 30 seconds under the key
infr:infra:storage:v1. This suppresses legacy-DB round trips and absorbs concurrent viewers. If the legacy DB is unreachable, the builder swallows the exception and returns an empty array, so the screen degrades gracefully toNo storage data.
Access
- View: any authenticated user (Infrastructure area minimum
user_level1 = demo) can view it. The route lives in theinfr.authgroup. - No writes: this screen is entirely read-only. There are no actions that change RAID/disk state or manipulate arrays (replacement/rebuild is done by an SE on the target host).
- Storage asset create/edit (device metadata, file areas) happens on the separate Assets ▸ Storage & Files screen, whose writes require
user_level2 or higher.
Troubleshooting & FAQ
Q. The card shows but the usage (DATA VOL) is empty.
The host's alias didn't match any df-* data in the recent seq window. Confirm run_report.js is running on that node and that the host↔alias mapping is correct. That mapping is a static map, separate from the run_report config in Admin ▸ Collectors.
Q. The disk map/controller says "No controller data".
storage_status.json_data has an empty controllers array or failed to parse. That host may have no Adaptec RAID, or sync_adp.js (arcconf) collection may be failing. Check the arcconf path and permissions.
Q. Everything says "No storage data."
Legacy DB connection failure, or storage_status has no rows. The builder returns an empty array on exception. Verify the legacy connection (.env DB_*) and the collector's health.
Q. The values are the same as a few minutes ago.
(1) This page doesn't auto-poll — press refresh. (2) The server cache lives for 30 seconds. (3) Fundamentally the collectors (sync_adp.js, run_report.js) run outside Laravel on a schedule, so source freshness depends on the cron cadence.
Q. A Degraded badge appeared — what do I do?
Find the Failed/Missing slot in the physical disk map, replace that disk, and confirm the controller begins an automatic Rebuild. During a rebuild the array is vulnerable to a double failure, so verify your backup posture as well (Backup ▸ Board).
Related
- Infrastructure ▸ Health — per-node CPU · memory · disk · service live status.
- Infrastructure ▸ Servers — per-server load time series.
- Infrastructure ▸ Alerts — disk-free / RAID-state alert policies.
- Assets ▸ Storage & Files — storage asset registry and file-area tree (writes).
- Administration ▸ Collectors —
sync_adp.jsandrun_report.jscollector registry.