Overview — what it does
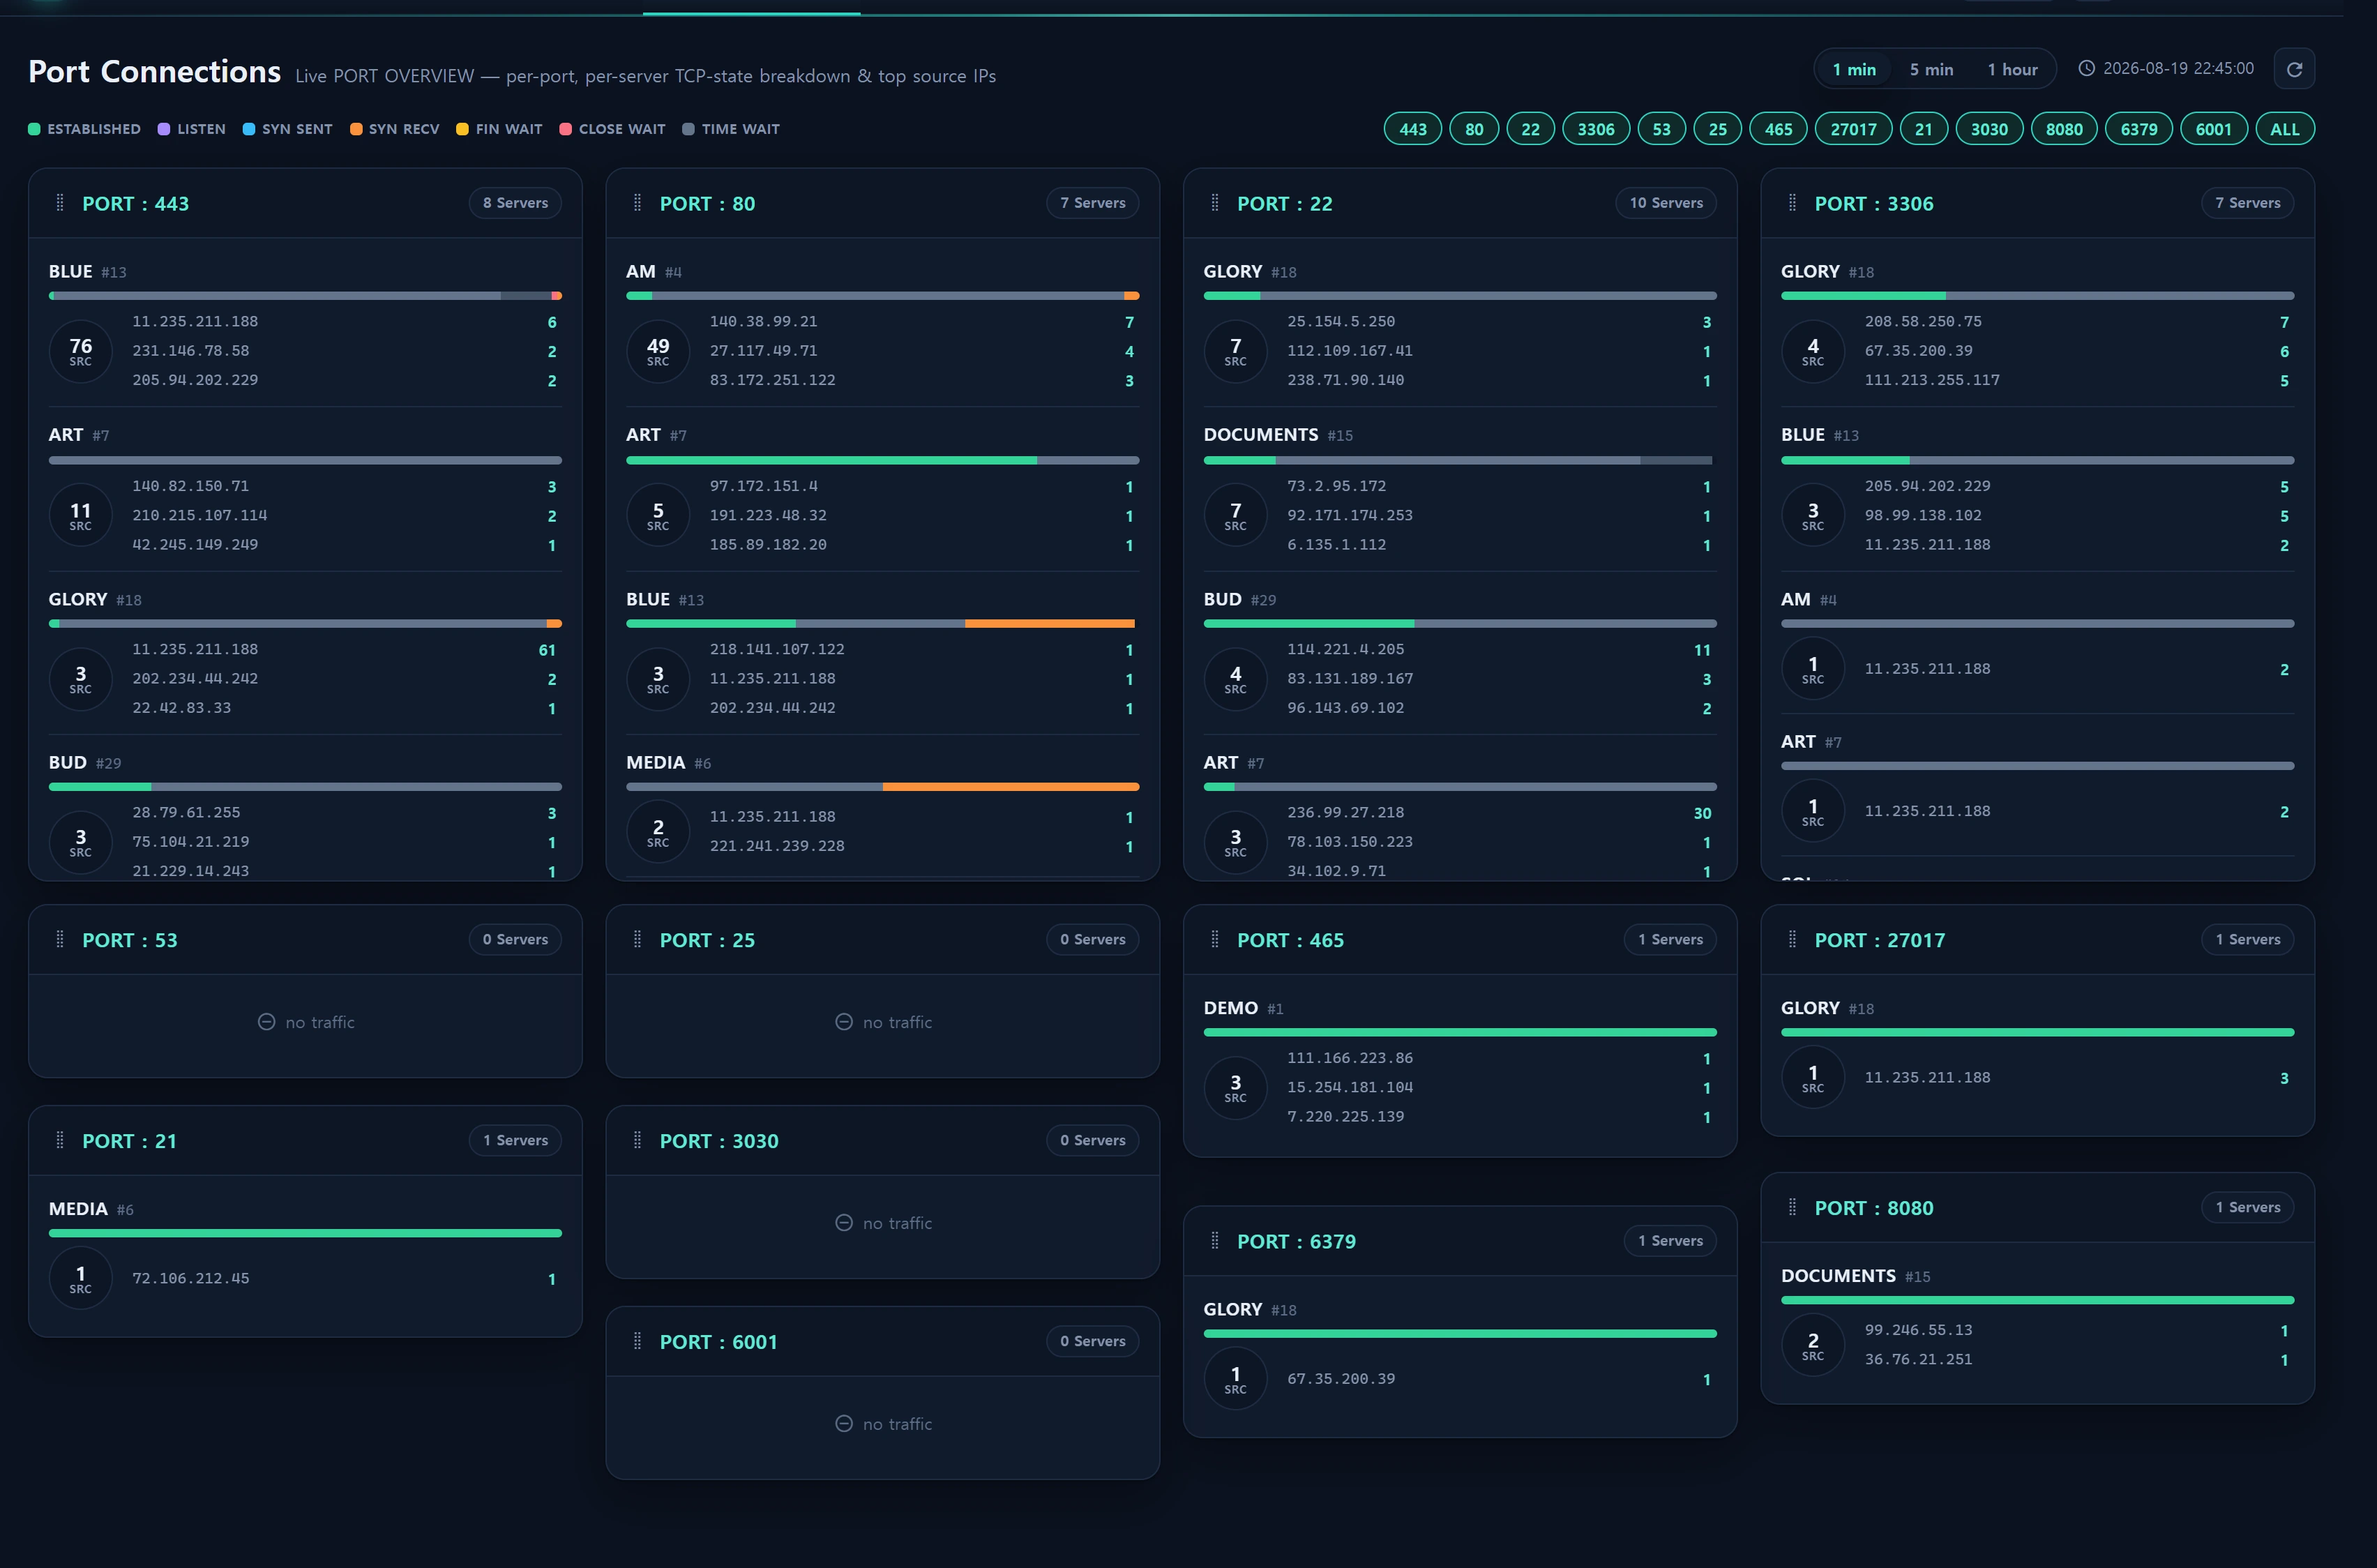
Port Connections is the flagship screen of Infrastructure ▸ Connectivity & Traffic — the PORT OVERVIEW. It renders one card per monitored port (e.g. 80, 443, 22, 3306 …) defined in Operations Policy, and inside each card it breaks the TCP sessions bound to that port per server into a 100% stacked bar by state. The goal: scan "who is connected to this port right now, how many, in what state" in a single view.
The source is the legacy traffic DB (legacy_glory connection), table traffic_session_ct, populated periodically by the check_ct.js collector. The app is read-only here — this screen writes nothing.
Each server tile shows:
- TCP-state 100% stack bar — proportions of ESTABLISHED / LISTEN / SYN SENT / SYN RECV / FIN WAIT / CLOSE WAIT / TIME WAIT (anything else →
other). ESTABLISHED is always placed first, the rest in descending session count. - SRC circle — the count of distinct source IPs (
remote_ip) bound to that server·port. Clicking it opens the source-IP list popup. - Top 3 source IPs — the three remote IPs with the most sessions, with counts.
When to use
- Spot connection surges / abnormal states: a spike in SYN_RECV (half-open) or TIME_WAIT on a port hints at SYN floods, connection storms, or app connection leaks.
- See which server bears the load: session distribution differs by server even on the same port — reveals load-balancer skew or an overloaded node.
- Track suspicious sources: click a top source IP or the SRC circle to drill into which servers·ports it hits and how much, plus geo/ASN and history, then hand off to reputation lookup or blocking.
- Deep-link entry: arriving from another screen (e.g. Service ▸ Web) with
?src_ip=…&port=…auto-filters to that port and opens the IP investigation popup.
Layout
Top controls
| Element | Behavior |
|---|---|
| Timer 1min / 5min / 1hour | Width of the session aggregation window. The choice persists to localStorage (infr:timer:traffic-ports) across visits. |
| Port chips | The monitored-port list (Operations Policy). Click a chip to toggle its card on/off. All toggles select/deselect all. Filtering is session-only (not persisted) — the default on each new visit is always all ports. |
| Snapshot time | The latest snapshot timestamp anchoring the current window (display-timezone corrected). |
| Refresh / polling | Automatically polls /infra/traffic/ports/live every 30 seconds to refresh cards. |
Port cards (masonry)
Cards are drag-reorderable, and the order is saved to localStorage (infr:order:traffic-ports). Because card heights vary, they lay out gap-free via row-span masonry (the sortable_masonry mixin). Within a card, server tiles sort by distinct source-IP count → total sessions → server index.
TCP state legend
Stack-bar colors come from semantic CSS tokens (var(--infr-state-*)). The legend maps color to state.
| Token | Label | Meaning |
|---|---|---|
established |
ESTABLISHED | Normally established connection |
listen |
LISTEN | Listening (server socket) |
syn_sent |
SYN SENT | Connect attempt (client) |
syn_recv |
SYN RECV | SYN received / half-open — a surge suggests SYN flood |
fin_wait |
FIN WAIT | Closing (FIN_WAIT1/2 merged) |
close_wait |
CLOSE WAIT | Peer closed, app hasn't — a buildup signals connection leak |
time_wait |
TIME WAIT | Post-close wait |
other |
Other | Any state outside the seven above |
How to use
- Pick a timer — use
1minfor the tightest, most recent snapshot batch;5min/1hourfor smoother trends. - Narrow to the ports you care about with chips — e.g. keep only 80·443 to watch web.
- Read the stack bar — a low ESTABLISHED share with large SYN_RECV/TIME_WAIT is an anomaly signal.
- Click the SRC circle — opens the source-IP list popup for that server·port (remote IP, remote ports, sessions, first/last seen).
- Click an IP → single-IP investigation — breaks down which servers·ports·states it hits, geo/ASN, and history (5min · hourly · daily rollup). From here you can proceed to reputation lookup or blocking.
- Reorder cards — drag frequently-watched ports to the top; the order is saved.
Daily (
1day) history, due to the rollup design, aggregates by the IP's /24 range (256 IPs) rather than the individual IP. When the popup shows a CIDR label likeby 211.224.128.0/24, that value is the sum across the whole range.
Data sources
Every query runs on the legacy_glory connection and is isolated in App\Repositories\TrafficRepository as parameter-bound query-builder calls (no string interpolation).
Window anchoring
The display window is anchored not to the app's now() but to the latest data snapshot (MAX(snapshot_ts)). The collector's write clock can lag the app clock by hours, so anchoring on now() would fall outside the data and yield a blank screen.
| Timer | SQL boundary (snapshot_ts) |
|---|---|
| 1min | startOfMinute … endOfMinute of the latest snapshot minute |
| 5min | startOfMinute of (latest − 4min) … latest endOfMinute |
| 1hour | startOfMinute of (latest − 59min) … latest endOfMinute |
The
snapshot_tsWHERE boundary uses the raw legacy stored time. Only the snapshot time shown on screen has the Operations Policy display offset (traffic_tz_offset_hours) added.
Core query — portOverview()
SELECT a.local_port, a.server_name, a.server_index, a.remote_ip,
       a.state_code, b.state_name,
       SUM(a.session_count) AS total_sessions
FROM traffic_session_ct AS a
LEFT JOIN protocol_state AS b ON a.state_code = b.state_code
WHERE a.snapshot_ts BETWEEN :min AND :max
  AND a.local_port IN (:ports)          -- Operations Policy monitored ports
GROUP BY a.local_port, a.server_name, a.server_index,
         a.remote_ip, a.state_code, b.state_name;
traffic_session_ct⋈protocol_stateresolves the integer state code into a human-readable state name for the legend and stack bar.- A tight
snapshot_ts BETWEENwindow plus thelocal_port INwhitelist narrows the large snapshot table (≈605K rows).
Related tables
| Table | Connection | Role | Fed by |
|---|---|---|---|
traffic_session_ct |
legacy_glory | Session snapshots (host/remote/state/count) | check_ct.js |
protocol_state |
legacy_glory | TCP state code → name lookup | — |
traffic_session_ct_5min/_1hour/_1day |
legacy_glory | Time-range history for the IP investigation popup | aggregate.js |
ip_info_loop |
legacy_glory | Geo/ASN/ISP enrichment for the IP popup | — |
Server response shape (excerpt)
{
  "ports": [80, 443, 22],
  "timer": 1,
  "snapshot": "2026-08-13 10:24:00",
  "ports_data": [
    { "port": 443, "server_data": [
      { "alias": "web1", "idx": 12, "host_count": 84,
        "top_req": [ { "remote_ip": "203.0.113.10", "session_count": 61 } ],
        "connections": [ { "state": "established", "count": 420, "pct": 78 } ],
        "total": 538 }
    ] }
  ]
}
portsData() caches for 20 seconds (keyed by timer + a hash of the port list) to suppress remote round-trips.
Access
The Infrastructure role area is viewable at minimum user_level 1 (viewer). Port Connections is read-only, so there is no separate write gate — demo (1), staff (5), and admin (10) can all view it. The route requires only infr.auth session authentication.
| Action | Level required |
|---|---|
| View port connections, poll, open IP investigation popup | 1 (any authenticated user) |
| Edit the monitored-port list (Operations Policy) | 10 (Administration) — Operations Policy |
The blocking action that follows from the IP investigation popup hands off to Security ▸ Blocklist, which requires write
user_level2+ and an audit log. This screen itself performs no blocking.
Troubleshooting & FAQ
Cards appear but server data is empty.
No sessions were bound to that port in the window. Widen the timer to 5min/1hour, or verify the port is actually open with traffic.
All cards are empty with "No connection snapshot".
traffic_session_ct on legacy_glory has no recent snapshot (the check_ct.js collector stopped, or the DB connection failed). If no latest snapshot time is shown, check the collector.
A port I want isn't shown.
If it's not in the monitored-port list (infra_monitored_ports), no card is created. Add it as CSV in Administration ▸ Operations Policy (1–65535, max 30, input order preserved). Default:
infra_monitored_ports = 80,443,22,3306,25,465,27017,21,53,3030,8080,6379,6001
The snapshot time is off by several hours.
When the legacy DB store clock differs from your display timezone, set traffic_tz_offset_hours (±14h) in Operations Policy to correct the displayed time. It is applied to display only, never to query boundaries.
Daily history is empty.
The _1day rollup can lag by a day and aggregates by /24 range. Check the 5min or hourly grain instead.
Related
- IP Connections (host view) — remote peer IPs × port strength per server
- Traffic (network I/O) — server_traffic in/out bytes·packets time series
- Operations Policy — monitored-port list and timezone offset settings
- IP Reputation — AbuseIPDB reputation from the investigation popup
- Firewall (attack surface) — physical open-port exposure monitoring
- Blocklist & Reputation — IP blocking that follows from the investigation popup