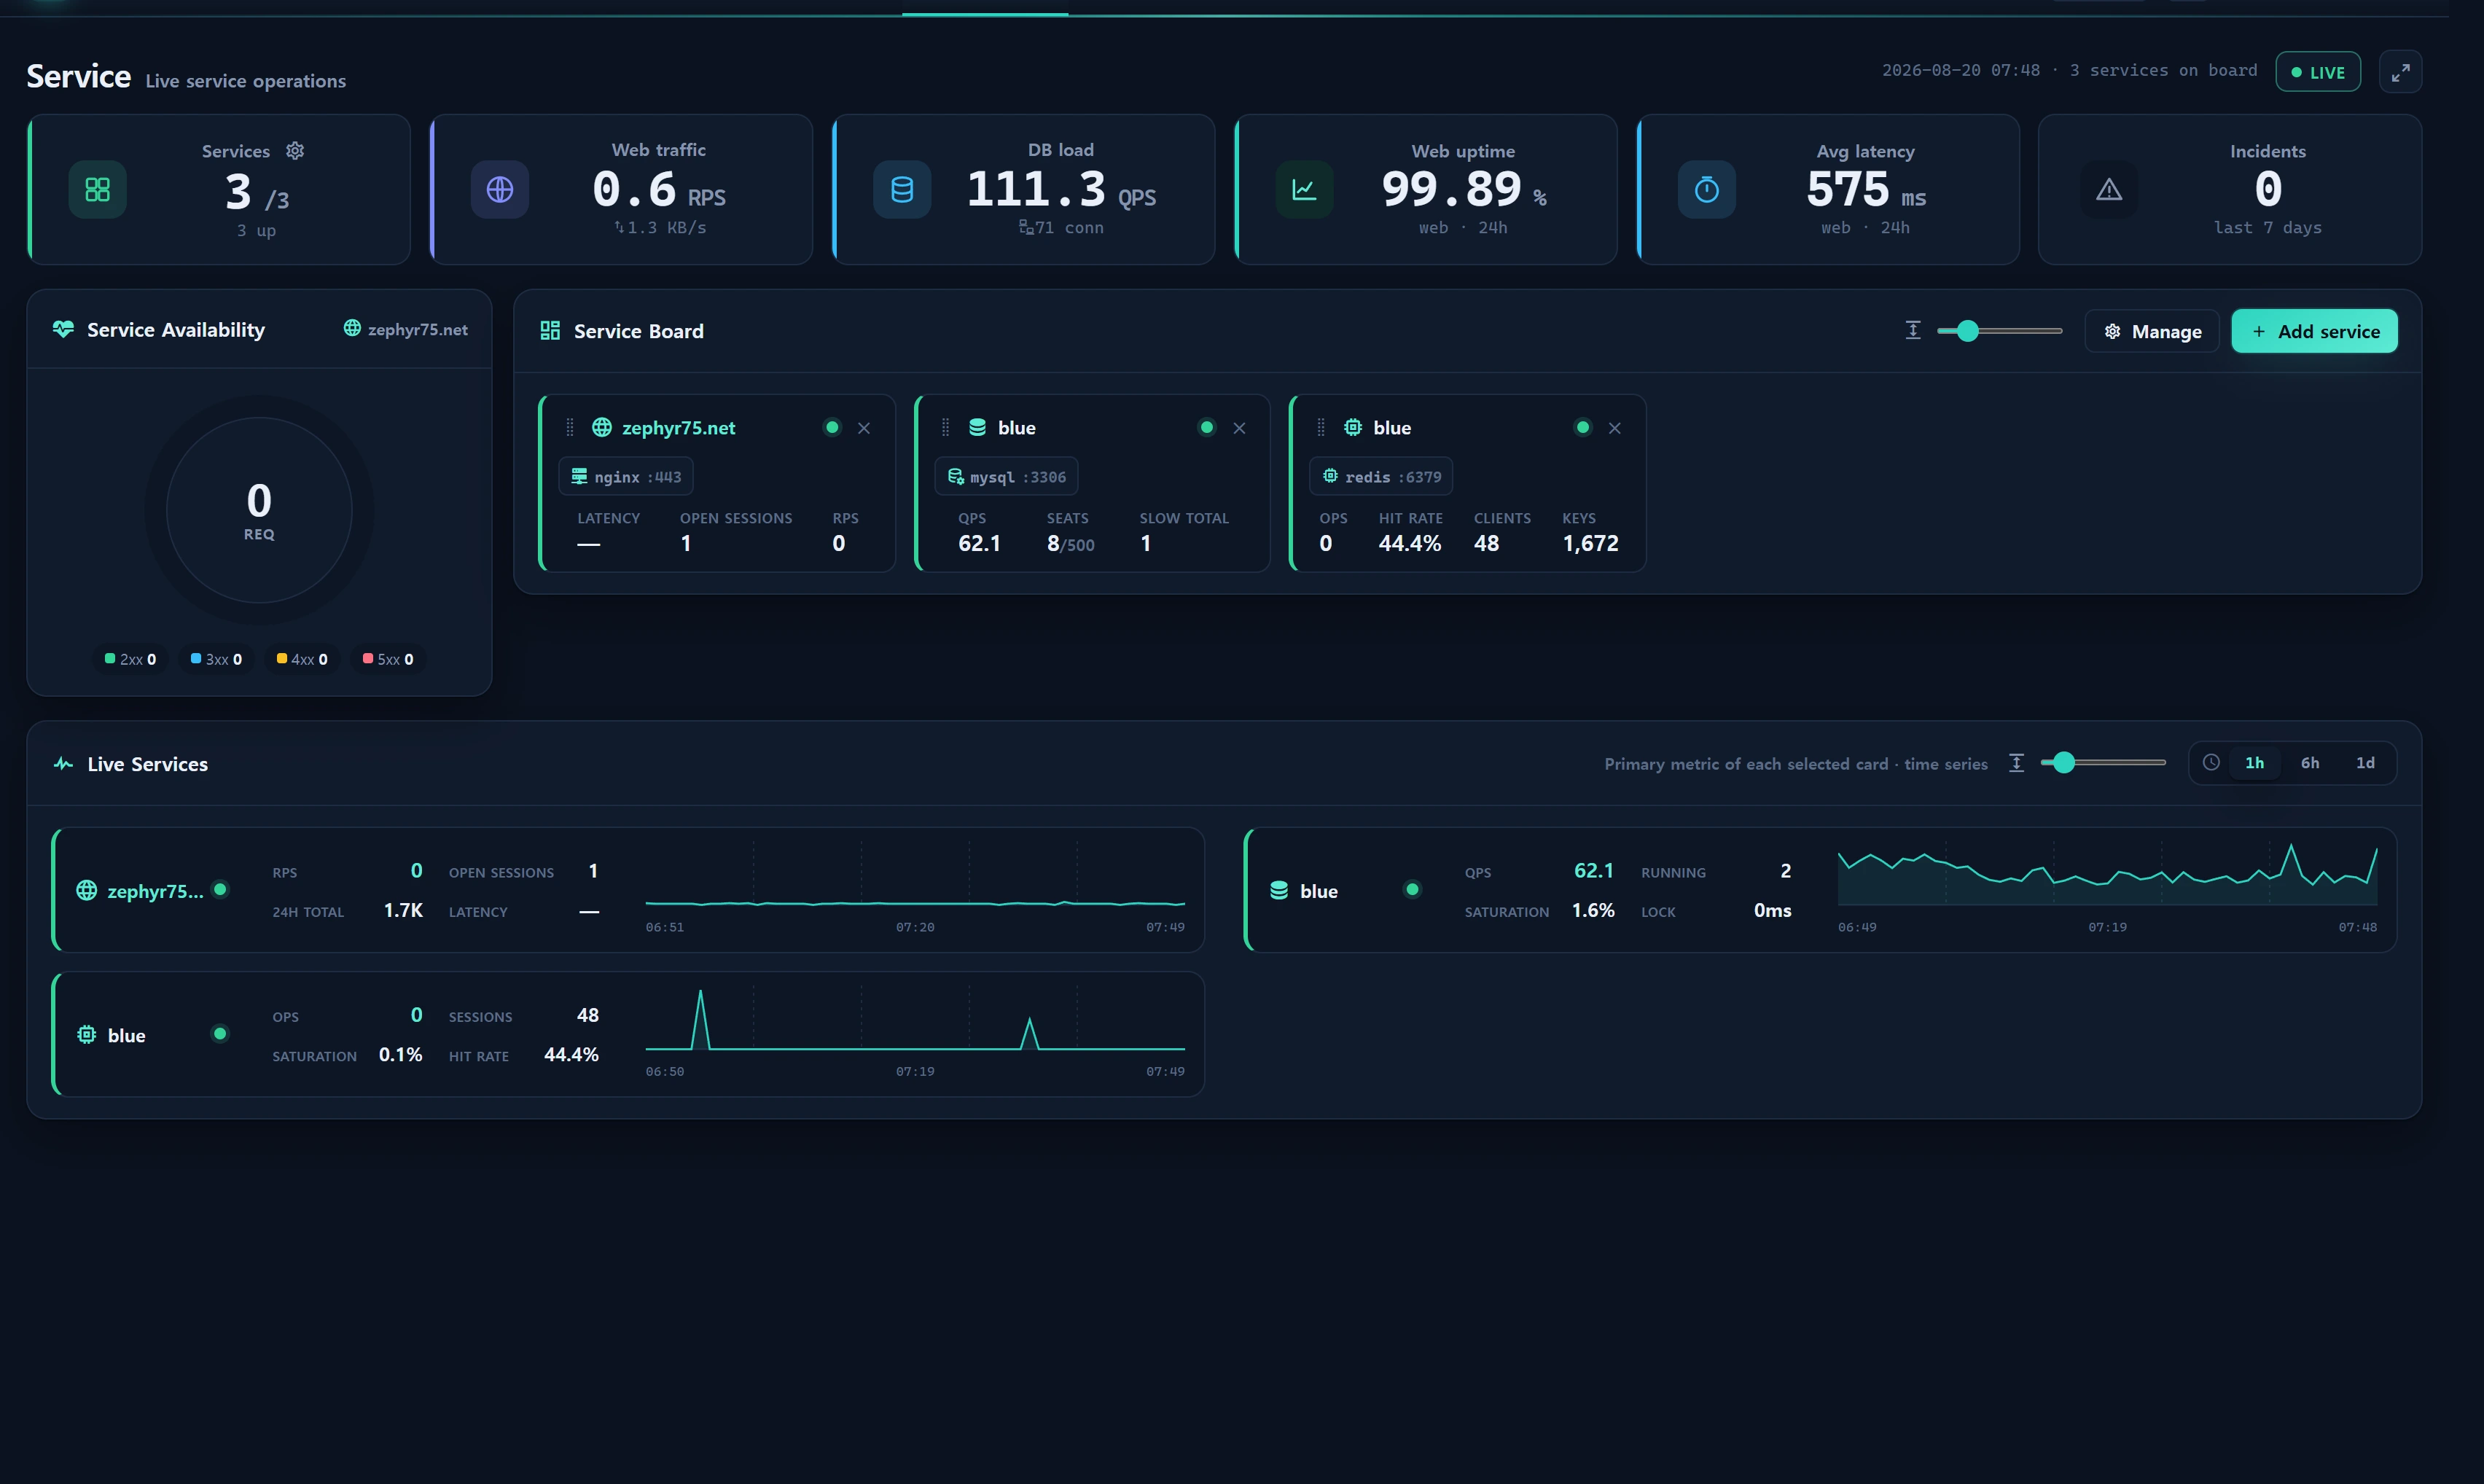
Overview — what it does
Service Overview is the first screen of the Service top-level menu (/service) — a curated, live operations board for running services (daemons). Operators hand-pick the services they care about and lay them out as priority cards. Each card shows a kind-specific set of live metrics, the first (highest priority) web/db/session card drives an availability gauge, and a bottom strip renders the live time-series of the selected cards.
Key traits:
- Selection and order live in the browser (localStorage) — nothing is stored server-side. Even for the same account, the board layout can differ per browser.
- Read-only and lightweight —
ServiceBoardService(15-second cache) unifies the underlying subsystems (web, DB, session, Catalog) into one canonical card shape. The screen does not open new direct connections to remote servers (except the DB card's just-in-time freshness sample — see below). - Logical reachability / load only. Physical open-port / exposure scanning belongs to Firewall (role boundary).
This board is not a demo fleet — everything is real data. Metric sources are the tables collectors already populate:
infr_web_metric,infr_db_metric,infr_redis_metric, andinfr_service(Catalog).
When to use
- To glance at a handful of core services (e.g. your flagship website, main DB, session Redis) in one screen at the start of a shift.
- As a NOC / wall-board dashboard (fullscreen button + height sliders fit it to the screen).
- To check a service's recent trend (1h / 6h / 1d) as a time-series.
- As a jumping-off point: get a feel here, then drill down into Web, Database, Sessions, or Catalog for detail.
Layout
Top KPI strip
Company-wide summary computed by realKpi() (refreshed by the 30-second poll):
| KPI | Meaning | Source |
|---|---|---|
| Web traffic | Total RPS + bandwidth across registered web services | WebMetricService::kpi(dashboard()) |
| DB load | Sum of latest stored QPS + total connections across access=database collectors | DbCollectorService::latest() |
| Web uptime | 24h availability | WebProbeService::availabilityOrPassive() (active-probe first) |
| Latency | Average probe response (ms) | same |
| Incidents | Incidents opened in the last 7 days | InfrIncident created_at ≥ now-7d |
Web uptime and latency prefer the active synthetic prober. Passive vts traffic counters alone misdiagnose no-traffic outages, 5xx hidden behind a 3xx, and counter resets — so the board uses
WebProbeService's real HTTP probe results. If the prober has not run yet (no coverage), it falls back to passive (web24h).
Service availability gauge
Drawn from the first web/db/session card in priority order (a placeholder hint is shown if none of those three kinds is on the board).
| Card kind | Gauge shape | Center value | Tone rule |
|---|---|---|---|
| web | 4-segment response-code donut | REQ (current RPS) | 2xx=good · 3xx=info · 4xx=warn · 5xx=crit |
| database | connection saturation (conn_pct) arc | QPS | ≥90 crit · ≥70 warn · else good |
| session | hit-rate arc | OPS | ≥90 good · ≥70 warn · else crit |
Service board (card grid)
Selected services are laid out as cards in priority order. Each card shows a different KPI set by kind:
| Kind | Default daemon | Header (alias) | Main KPIs |
|---|---|---|---|
| web | nginx | representative domain | latency · RPS · open sessions (active connections) · 24h cumulative requests · error rate |
| database | mysql/mariadb/postgres/mongo | collector alias | QPS · seats (used/max) · saturation · running · lock (avg row-lock ms) · slow total · waiting |
| session | redis | node alias | OPS · hit rate · clients (current sessions) · keys · saturation (memory used %) |
| proxy | software_key/proxy | instance alias | dependencies (+N) · latency · listen ports |
| docker | software_key/docker | instance alias | dependencies (+N) · latency · listen ports |
- Cards are reordered by drag handle (SortableJS) — DOM order becomes the priority (
sel) and is persisted to localStorage. - The ✕ at the card's top-right removes it from the board.
- proxy/docker cards have no availability donut and no time-series (web/db/session only).
Live service (bottom time-series)
Selected cards that have a series (web/db/session) are drawn as SVG area+line sparks in a 2-column grid. Each graph carries a ruler (vertical gridlines + start/mid/end HH:MM labels) to identify the timeline. A top range toggle (1h · 6h · 1d) switches the window (default 1h).
Header controls
- LIVE toggle — turn the 30-second poll on/off.
- Fullscreen button — hides the top nav and fills the body (ESC to exit ·
fullscreenmixin ·body.infr-fs). - Two height sliders — board card height (default 118px, 90–240) and live chart height (default 50px, 34–160). Fit values persist to localStorage.
How to use
1) Pick services
- Click [Select Services] / [Add Service] in the board header to open the picker modal.
- The modal groups all available services by kind (web → database → session → proxy → docker).
- Toggle services on (✓) / off. Selection reflects on the board immediately and is saved to localStorage.
First-visit default = the first item of each of web, database, and session is auto-selected so the availability gauge works out of the box. Deselect in the modal if you don't want them.
2) Adjust priority
- Grab a card's drag handle and move it. The frontmost web/db/session card becomes the availability gauge target.
3) Change the time window
- Use the 1h / 6h / 1d buttons on the bottom live strip. Switching issues
POST /service/series, which re-fetches the selected cards' representative metrics over that window (downsampled to at most 60 points); if the response is empty it falls back to the card's bundled series.
// POST /service/series request example
{ "keys": ["web:12", "db:db@blue", "session:blue"], "range": "6h" }
Card key convention:
web:{infr_web_service.id}
db:{infr_collector.key}      e.g. db@blue
session:{node_alias}         e.g. blue
proxy:{infr_service.id}
docker:{infr_service.id}
4) Fullscreen situation board
- Fullscreen button → tune card/chart heights with the sliders to fit the screen for a wall-mounted NOC board.
Data sources
| Card kind | Builder | Actual tables |
|---|---|---|
| web | WebMetricService::dashboard() + WebProbeService::overlayStatus() |
infr_web_metric (vts counters) · infr_web_check (active probe) · infr_web_service |
| database | InfrCollector(access=database) + DbCollectorService::latest()/series() |
infr_db_metric · infr_collector |
| session | RedisMetricService::dashboard() |
infr_redis_metric · infr_instance |
| proxy/docker | InfrService(kind IN proxy,container) |
infr_service · infr_instance |
| KPI incidents | — | infr_incident (last 7 days) |
Time-series sources:
- web — delta of the main domain / main node
request_counterininfr_web_metric→ RPS (avoids multi-node counter mixing). - database —
infr_db_metric.qps(stored metric, no live connection). - session —
infr_redis_metric.instantaneous_ops_per_sec.
Status tokens
| Token | Meaning |
|---|---|
| up | healthy |
| degraded | degraded |
| down | outage (real connection/probe failure) |
| pending | waiting (judgment deferred, e.g. data lag) |
DB card false-red avoidance — in economy collection mode, if collection lags briefly and the last sample is more than 5 minutes old,
statusOfreturnsdownfor a stale reason. The DB is fine but you'd see a red alarm — so the board demotes stale down topendingand keeps down only for a real connection failure (ok=false). Additionally, only for a present user looking at the board, if the last sample is more than 45 seconds old it takes a just-in-time single sample viaensureFresh(45)(a no-op with no connection when the scheduler is already collecting), and that sampler purges the connection in a finally block to prevent leaks.
Access
- Read (view): any authenticated user (demo=1 and up).
/servicesits in theinfr.authgroup with no additional level gate. - No writes: this screen is purely read. Card selection, order, heights, and range are all stored only in browser localStorage — nothing is written server-side. With no destructive action, no audit log is recorded either.
- Writes on the detail screens (Web website management, Database, Catalog build/edit) are gated there (e.g. level≥2).
localStorage keys:
infr:svcboard:sel:v1        array of selected service keys (order = priority)
infr:svcboard:h:v1          board/live height slider values
infr:range:service-overview bottom time-series range (1h/6h/1d)
Troubleshooting & FAQ
The board is empty. Use the header [Add Service] to place the services you care about. If there are no available services at all (collectors haven't populated data yet), the picker groups may look empty — verify Collectors registration and the collection pipeline first.
The availability gauge doesn't appear. The gauge requires a first web/db/session card in priority order. If you only picked proxy/docker, you'll see a placeholder hint. Put at least one web/db/session card near the front.
The bottom time-series is empty. Only web/db/session cards have a series; proxy/docker are excluded. Also, if the source table has no data in the chosen window (1h/6h/1d), the graph will be empty.
A DB card is red but the DB is fine.
Data lag demotes to pending (grey/waiting). If it's still down, that's a real connection failure — check the Database screen and the access=database collector state under Collectors.
Cards persist across refresh / look different on another PC. Selection and order are owned by browser localStorage, not a server account setting. They are independent per browser and device.
I want a 5-minute window. The current implementation offers 1h · 6h · 1d windows (default 1h). For shorter observation use the dedicated screens like Servers or Database.
Related
- Service ▸ Web — registered-website vts live monitoring + active-probe uptime
- Service ▸ Database — direct-connect DB load and schema analysis
- Service ▸ Sessions — Redis session capacity and throughput
- Service ▸ Catalog — derive services from the version ledger (proxy/docker source)
- Administration ▸ Collectors — collector registry (metric source)
- Realtime / polling — how live refresh works