Overview — what it does
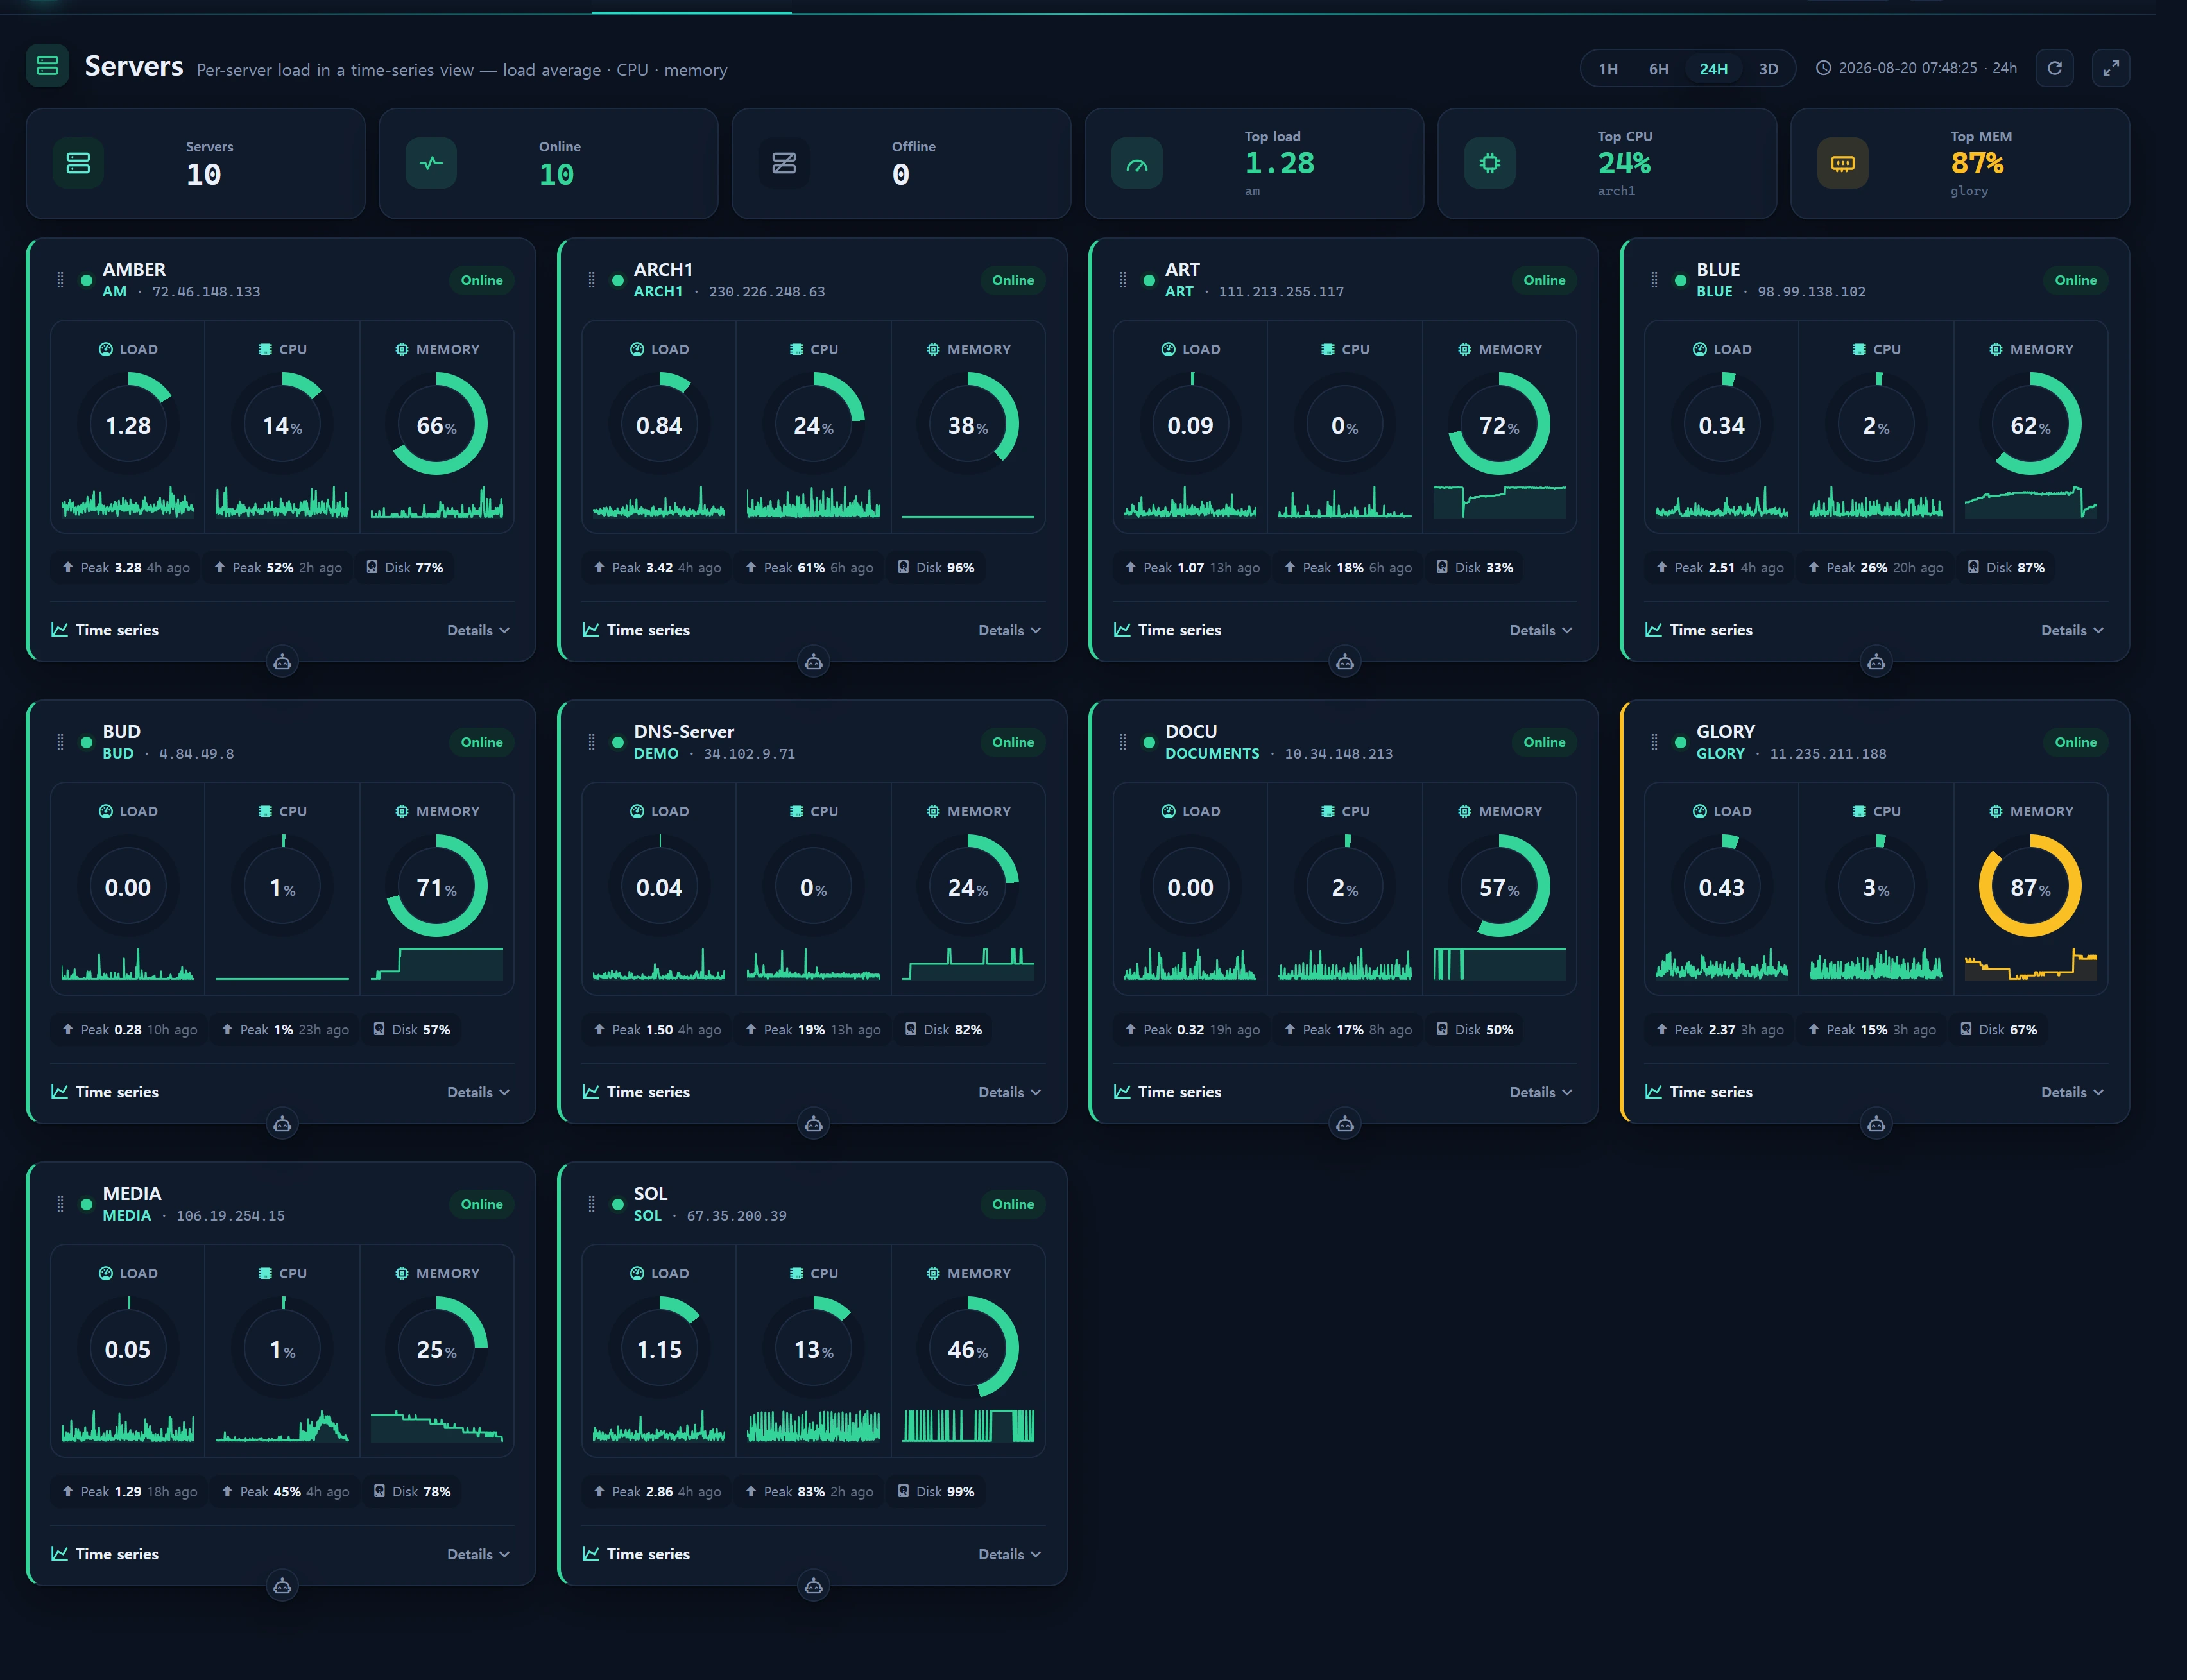
Infrastructure ▸ Servers (/infra/servers) shows load average · CPU · memory for every registered server node from a time-series perspective. Where the Health screen captures the "state of each node right now" via live probes, the Servers screen focuses on "how load flowed over the last few hours to days." It is a re-implementation of stats-design's monitoring/part (load_average · cpu_usage · memory_usage).
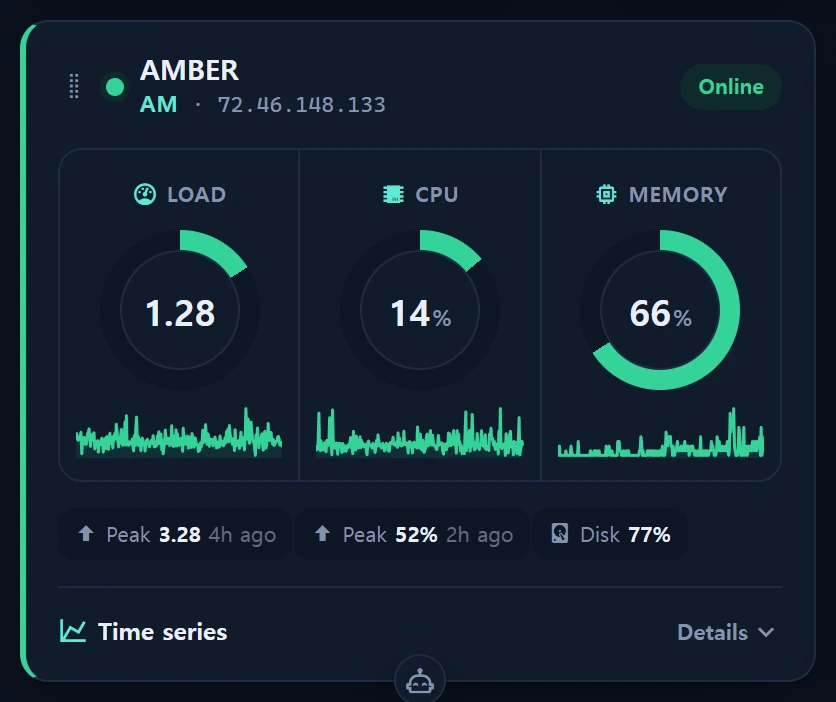
One card per node:
- Three ring gauges (Load / CPU / MEM current value) — severity at a glance.
- SVG sparkline — a preview of the recent trend.
- [Expand] → combined ECharts line chart (CPU% · MEM% on the left axis + Load on the right axis) and a stats table (current / average / min / max + peak time).
Metrics come from the legacy server_status table (read-only). The builder ServerMetricService narrows the query to a recent seq window (avoiding a slow full scan) and applies a 20-second cache. The card grid supports drag-to-reorder + masonry and auto-refreshes via 30-second polling.
server_statusis populated by the Node collectorrun_report.jsrunning outside Laravel on roughly a 5-minute cycle. The time-axis resolution is therefore about 5 minutes, and the screen refreshes by polling (not by realtime push / Reverb).
When to use
- To compare which servers carry sustained high load across the whole fleet.
- To revisit the inflection points of the load / CPU / memory curves around the time an incident or alert fired (peak time is shown too).
- To check a memory-usage trend or CPU saturation after a deploy or a traffic spike.
- As follow-up investigation when Alerts fire on load-average or disk-headroom conditions — confirm the offending node on the time series.
Live session monitoring (with service dots for nginx/php/mysql) lives on Health, network I/O byte/packet graphs on Traffic, and disk / RAID health on Storage & RAID.
Layout
Top KPI bar
Computed by ServerMetricService::kpi().
| KPI | Meaning |
|---|---|
| Servers | Total node count present in the window |
| Online | Nodes that reported loadavg within the last 2 collection cycles |
| Offline | Total − online |
| Hottest load | Node with the highest current 1-minute load + alias |
| Hottest CPU | Node with the highest current CPU% + alias |
| Hottest MEM | Node with the highest current memory% + alias |
Range toggle
Selects the display window (number of seq-window points). The choice is stored in localStorage (infr:range:infra-servers) and persists across visits.
| range | seq points | ≈ actual window (5-min cycle) |
|---|---|---|
| 1h | 12 | ~1 hour |
| 6h | 72 | ~6 hours |
| 24h | 288 | ~24 hours (default) |
| 3d | 864 | ~3 days |
range is converted to "the last N collection cycles" (not an absolute time span). At a 5-minute cycle, 24h ≈ 288 points. A node that reports infrequently may show a shorter actual window for the same range — the window label at the bottom reports the real span as
24h/6h/45m/2d.
Node card
┌──────────────────────────────────────────────┐
│ label · alias · IP           online / last Nm │   ← header (label enriched from infr_instance)
│  ( Load )   ( CPU )   ( MEM )                    │   ← 3 ring gauges (current value)
│  ▁▂▅▇▅▃  sparkline (SVG polyline)               │
│  peak · disk 42% · net out 1,234      [Expand] │   ← footer
└──────────────────────────────────────────────┘
The card border and gauges are painted with a threshold tone; the card's overall severity follows the worst of the three metrics.
| Metric | good | warn | crit |
|---|---|---|---|
| Load (1-min) | < 8 | ≥ 8 | ≥ 16 |
| CPU % | < 70 | ≥ 70 | ≥ 90 |
| MEM % | < 85 | ≥ 85 | ≥ 95 |
The Load ring is normalized so it is full at load 8 (
LOAD_FULL=8) — aligned with the warn threshold. On a machine with many cores, load 8 is not necessarily dangerous, so always read the absolute value from the number in the ring's center as well.
Expanded detail (ECharts + stats)
Pressing [Expand] grows the card vertically; masonry automatically reflows the height change.
- Combined line chart:
CPU%·MEM%(left axis 0–100%) +Load(right axis, auto-scaled). The x-axis is the latest timestamp of each collection cycle (HH:MM), with a crosshair tooltip. - Stats table: for each metric (load / CPU / memory) the current · average · min · max, plus when the peak occurred (e.g. "peak 12m ago").
How to use
- Open
/infra/servers→ node cards are laid out in ascending alias order. - Pick an observation window with the range toggle (1h/6h/24h/3d). It re-queries immediately, independent of polling.
- Open the time-series chart and stats table for a node with [Expand].
- Hover the chart to read the CPU/MEM/Load values at a given time via the crosshair.
- Drag cards to float the nodes you watch most to the top — the order persists in
localStorage(infr:order:infra-servers). - Use the fullscreen button in the header to hide the top nav and view in dashboard mode.
The screen auto-refreshes every 30 seconds by polling /infra/servers/live (no interaction needed). This screen has no write / control actions — it is purely observational.
The polling front-end decides whether a refresh is needed using the cheap change token
rev(= the latest seq ofserver_status). Until a new collection cycle arrives, the screen stays put — that is not "frozen," there simply is no new snapshot yet.
Data sources
The source is the legacy server_status table (MAIN DB, key-value part schema, read-only). It interprets the run_report.js storage convention directly.
| part | Value format | Meaning | Series use |
|---|---|---|---|
loadavg |
"1m 5m 15m" space-separated (e.g. "0.50 0.42 0.38") |
Load averages | Series/ring use the 1-minute load only; the footer also shows 5/15-min |
top |
"NN%" (e.g. "3.6%") |
CPU user usage | CPU series/ring |
free |
"NN%" |
Memory usage = round(used/total×100) | MEM series/ring |
df-data / df- / df-home |
JSON {p,u,a} |
Disk pct (p) · used (u) · size (a) | Latest disk badge (df-data → df- → df-home priority) |
traffic-out |
numeric | Network-out packet delta | net series/footer |
Query and shaping discipline:
- seq window:
SELECT DISTINCT seq ORDER BY seq DESC LIMIT N(index scan) picks only the last N collection cycles, then those seq/part values drive awhereInquery — so even a 200M-row table only scans a narrow window. Same discipline asOverviewService/HealthService. - seq = a fleet-wide snapshot batch id. Series are always sorted past → present.
- Missing-value carry-forward: if a part is absent for a cycle, the previous value is carried forward (to avoid gaps in the graph).
- Online decision: a node is online if loadavg is present in the last 2 cycles (one dropped cycle is tolerated).
last_seen= the timestamp of the last cycle that reported loadavg. - 20-second cache:
Cache::remember("infr:srvmetric:v1:{points}", 20, …). So even with 30-second polling, the actual DB query runs at most once every 20 seconds. - Label/IP enrichment: alias/hostname (lowercased) is mapped to
nameandip_public/ip_privatefrom Instances (infr_instance), cached 60s. Unregistered nodes display their raw alias.
Registration and credentials for the run_report.js collector that fills server_status are managed under Administration ▸ Collectors.
Access
- Read-only screen. Any user who passes console authentication (
infr.auth) can view it (the Infrastructure role area's minimumuser_levelis 1 — i.e. demo=1 and above). - No write / control actions — there are no block or restart buttons here.
- Card order and range selection are not stored server-side; they live only in the browser's
localStorage(per user, per browser).
Level scheme: demo=1 · staff=5 · admin=10 (see RBAC levels).
Troubleshooting & FAQ
I only see "No server metrics."
There is no recent snapshot in server_status. Check that the run_report.js collector is running and registered under Collectors. Also verify the legacy (MAIN) DB connection.
A node shows as offline.
It means no loadavg was reported within the last 2 collection cycles. Check that node's run_report run status, its clock (skew), and network. The last_seen relative label tells you when it last reported.
A card shows an alias (e.g. sol) instead of a friendly name.
That alias is not registered in Instances (infr_instance). Register the instance and its name becomes the label, with ip_public/ip_private shown as the IP.
The disk badge is empty.
That node reported none of df-data/df-/df-home in the JSON {p,u,a} format. For detailed disk usage and RAID health, use Storage & RAID.
The Load ring always looks full. The Load ring is normalized with a ceiling of load 8. On many-core servers load 8 may be normal, so judge by the absolute value shown in the ring's center. Do not conclude danger from the color tone thresholds (warn 8 / crit 16) alone.
It polls every 30s but nothing changes.
Either (1) a new collection cycle (~5 min) has not yet arrived, or (2) you are inside the 20-second cache window. Confirm real updates via stamp, the window label, and rev (the latest seq).
I set range to 3d but the window looks short.
range means "the last N cycles," so a node that collects infrequently has a short real time span. The bottom window label shows the actual span (45m/6h/2d). The point-count ceiling is 1000.
Related
- Health — live status and service dots (nginx/php/mysql) for the same nodes.
- Storage & RAID — disk usage, RAID controller health, physical disk map.
- Traffic — network I/O byte/packet time series.
- Alerts — SMS/email to recipients on load-average and disk-headroom conditions.
- Instances — the source of alias→label/IP enrichment (asset registry).
- Collectors — registry for the
run_reportcollector that fillsserver_status.