Overview — what it does
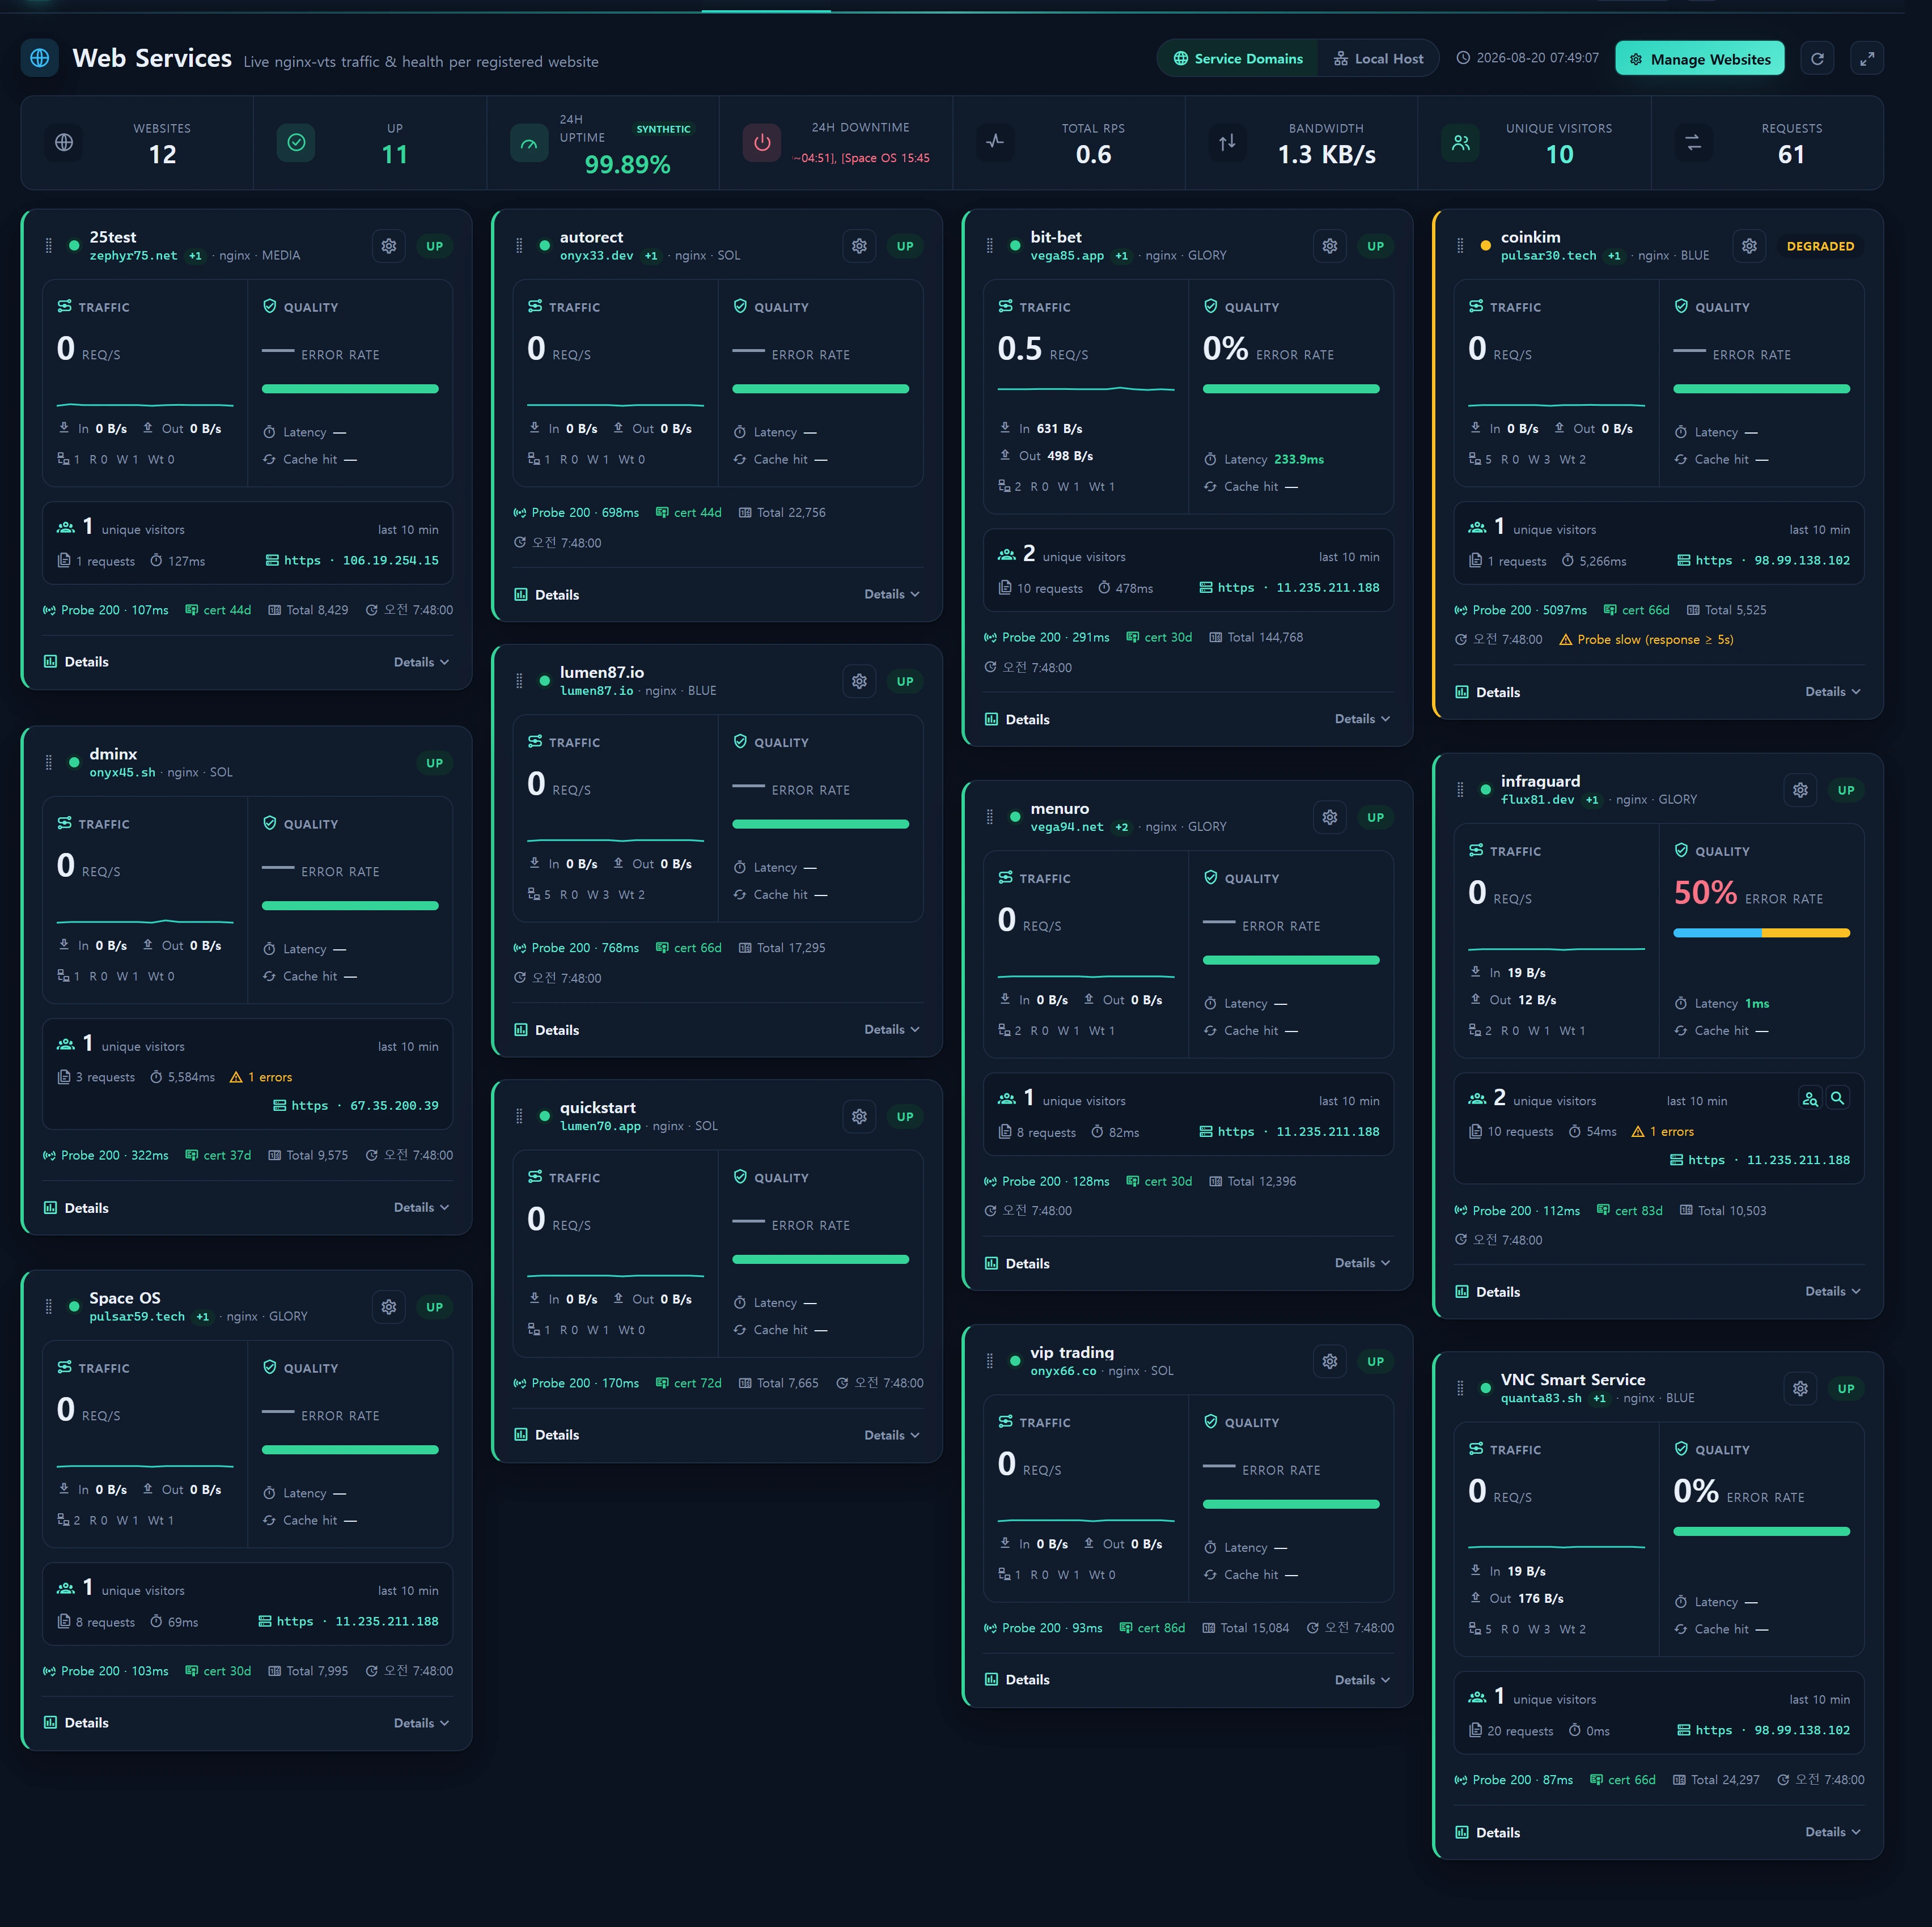
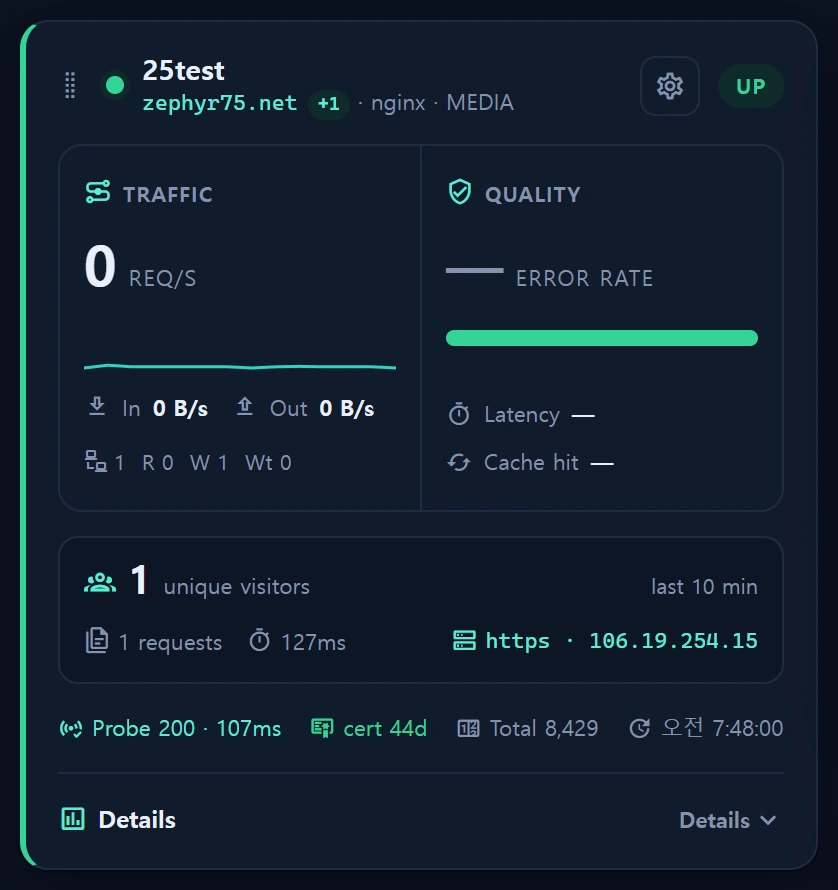
Service ▸ Web gives live per-website monitoring for registered sites (infr_web_service) plus website management. Cards show traffic (RPS, bandwidth, connections) and quality (error rate, response-code stack, latency, cache hit) derived as deltas from vts counters in infr_web_metric.
Layout
Two-metric operational cards + RPS sparkline + an access-intel strip (unique visitors, requests, avg latency, serving server) + collapsible detail (response-code counts, recent URIs, top caller IPs). Register unlisted zones via the management modal.
How to use
- The website management modal registers domains (typeahead), including multiple domains per service (
domainsJSON); metrics across all of a service's domains are summed. - Access intel comes from
nginx_meta_ct(legacy_glory) via one batchedhost IN(...) AND event_ts BETWEEN(...)query.
24h uptime/downtime comes from an ACTIVE synthetic prober, not just passive vts counters.
WebProbeService+infr:probe-web(per-minute,infr_web_check) HTTP-GET each site (following redirects) to catch outages that counters miss: zero-traffic downs, 3xx-hidden 5xx, and counter resets. TLS certificate expiry is checked per domain (infr_web_cert, 6h rotation) and badged good/warn≤21d/crit≤7d.
Data sources
infr_web_service/infr_web_metric/infr_web_check/infr_web_cert·nginx_meta_ct(legacy_glory)WebMetricService·WebProbeService
Access
Read level≥1; write (register/edit/delete) level≥2 + audit.
Related
- Visitor & search insights — the person/magnifier icons on a card (GA4 visitors, Search Console keywords)
- Infrastructure ▸ Alerts (cert-expiry / URL probe conditions) · Service catalog · Service overview