Overview — what it does
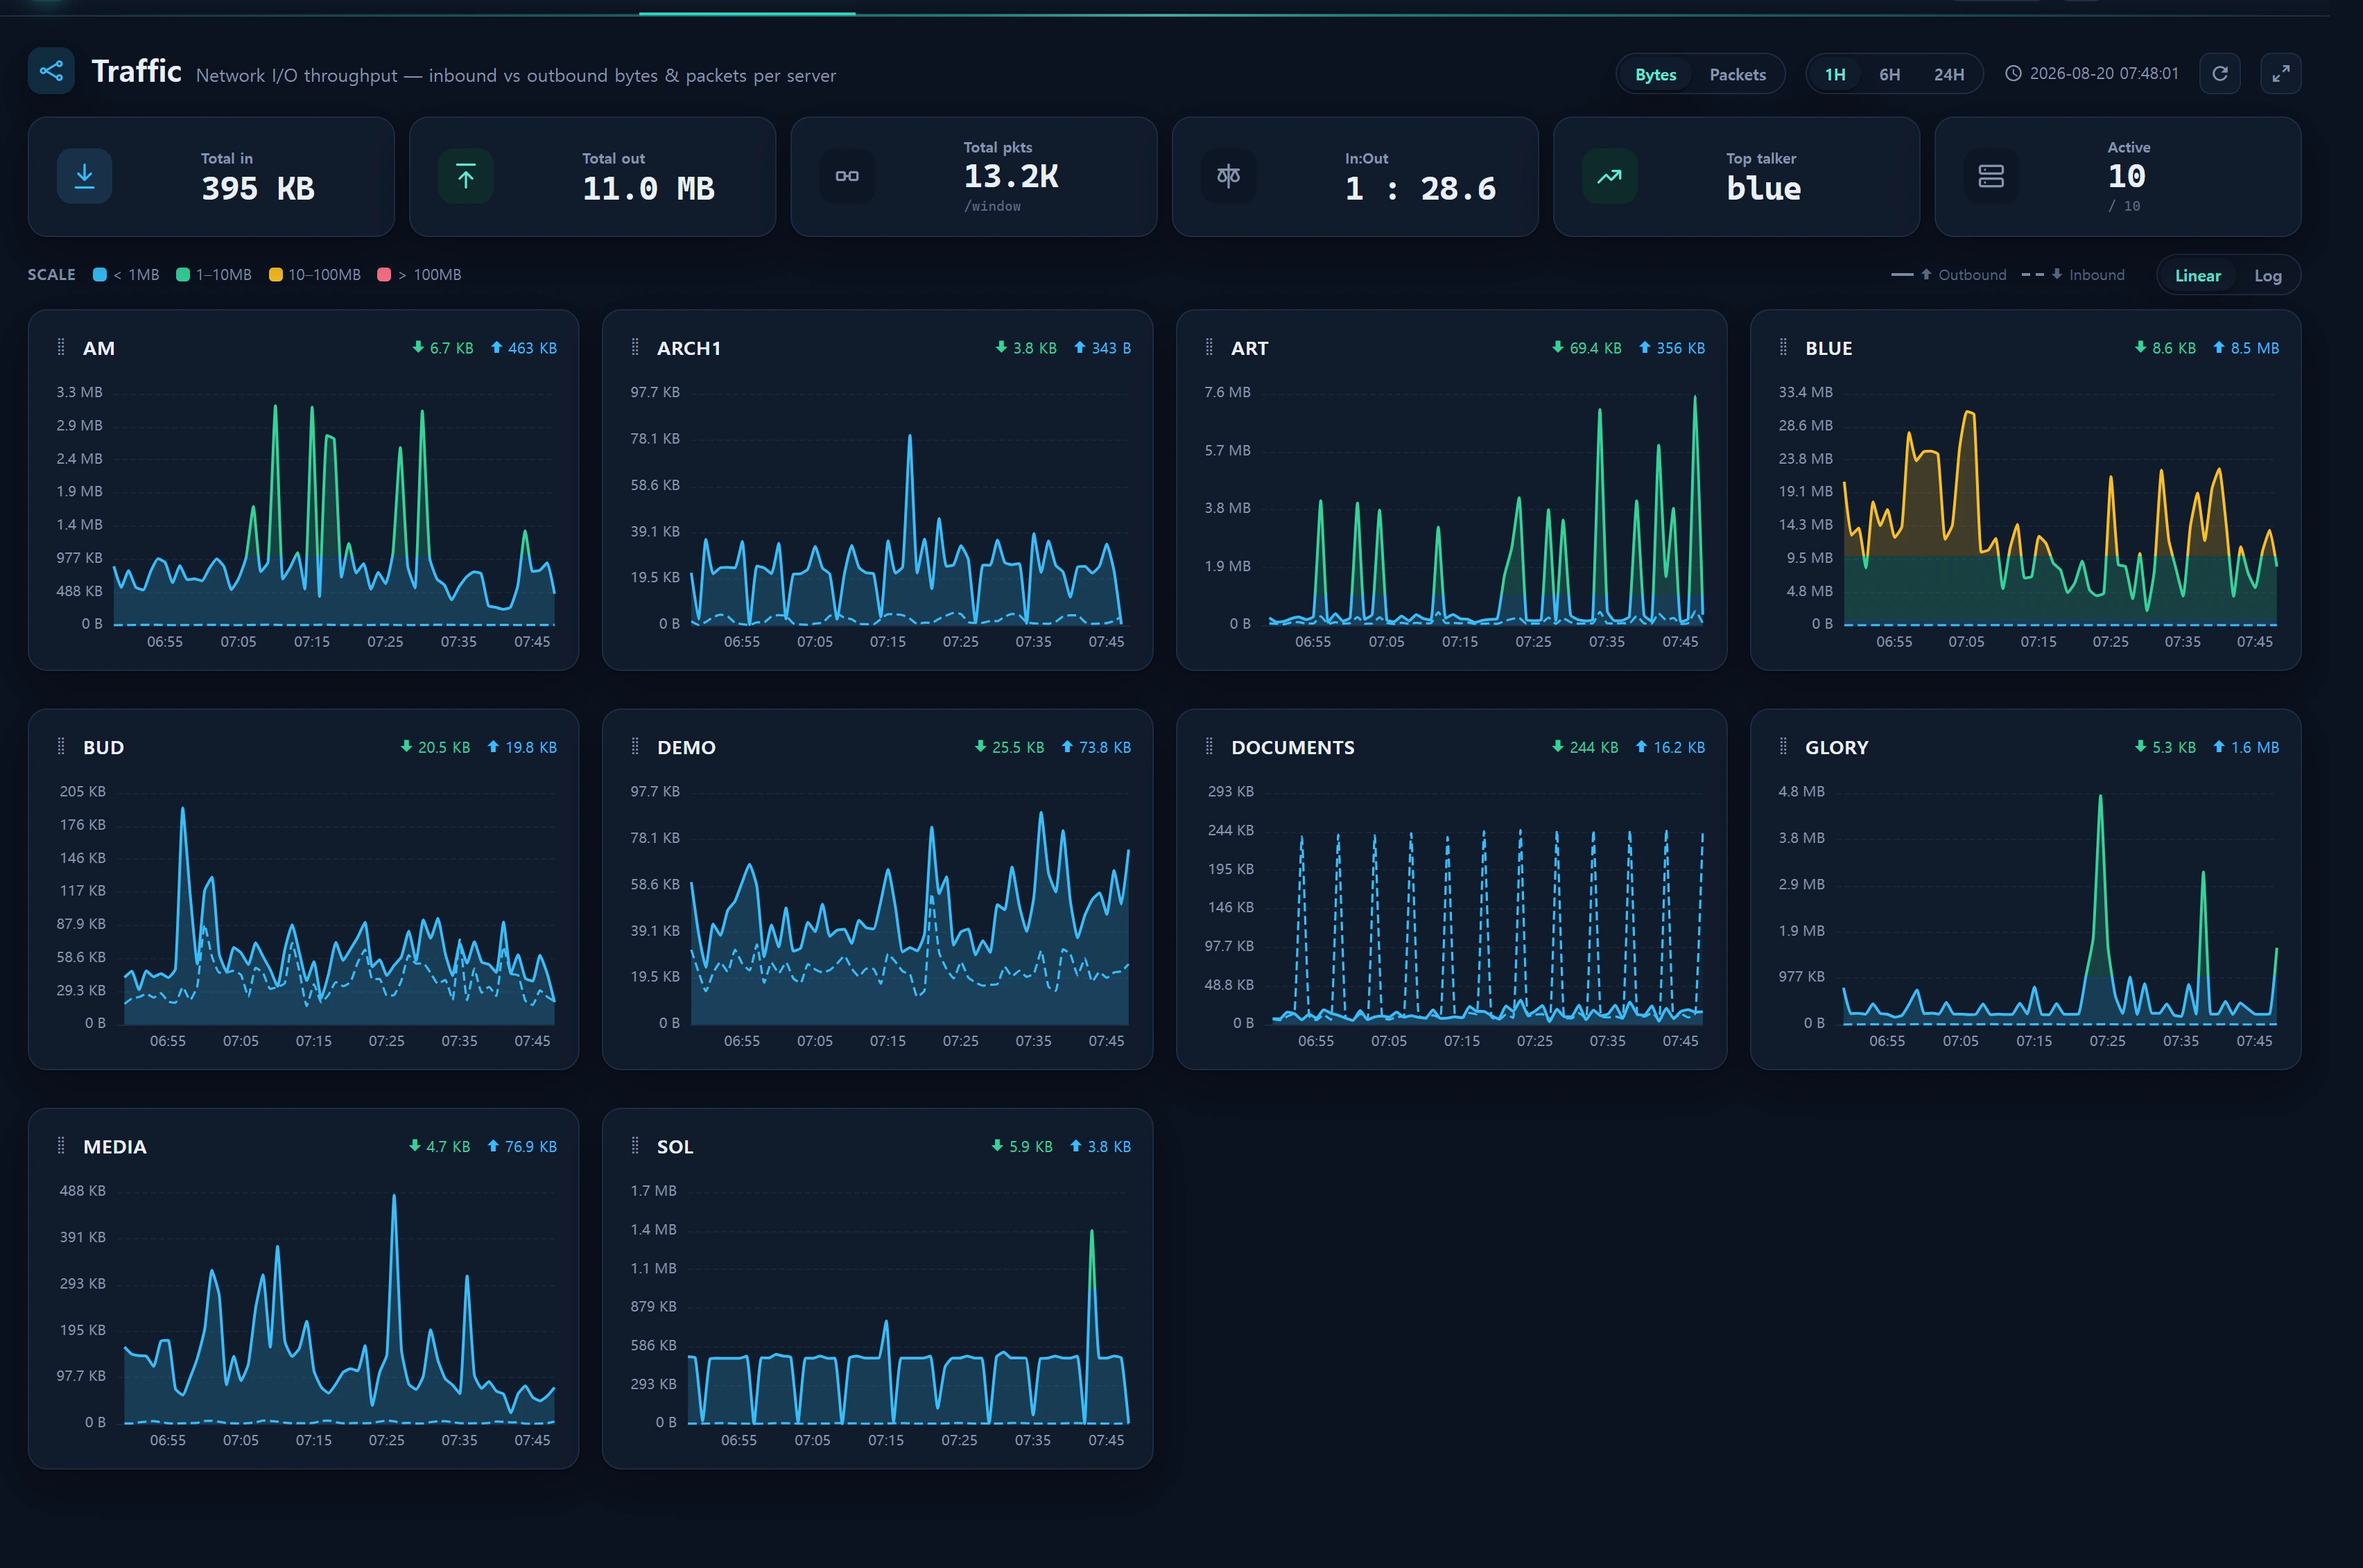
Infrastructure ▸ Connectivity & Traffic ▸ Traffic (/infra/traffic/net) is a read-only console that plots each server's network I/O throughput (inbound/outbound bytes and packets) as one ECharts line chart per server card.
The source is the legacy server_traffic table (≈1.6M rows, legacy_glory connection), filled by the legacy collector check_tx.js. That table accumulates per-window delta bytes and packets for each server × direction (inbound/outbound), but the old stats-design UI only ever showed server_status's traffic-out (a single outbound-packet delta). This screen is the first to surface the full in/out × bytes/packets dataset.
The three sibling screens (Ports, IPs, Traffic) share the same
TrafficControllerandSessionQueryService, but only the Traffic tab reads theserver_trafficthroughput time series rather than the session snapshot (traffic_session_ct). That is why it uses a range (1h/6h/24h) window instead of the timer (1/5/60 min) used by the other two.
When to use
- To trace bandwidth spikes/surges on a specific server over time (nightly backup transfers, large downloads, DDoS ingress).
- To read a server's character from its in:out ratio (web servers skew outbound; backup receivers skew inbound).
- As a first-pass screen for nodes whose outbound packets/bytes jump suddenly, before drilling into Security ▸ Threats or the IP investigation popup.
- To spot stale (collection-lagged) servers at a glance via the freshness KPI.
Layout
Hero (top bar)
| Element | Description |
|---|---|
| Metric toggle | bytes | packets — recolors the same data on a byte/packet scale (no server round-trip) |
| Range toggle | 1h (60) | 6h (360) | 24h (1440) — display window in minutes. Selection persists to localStorage |
| Stamp | Latest window time (server_traffic MAX + display-timezone shift) |
| Refresh | Immediate re-fetch (independent of the 30s auto-poll) |
| Fullscreen | Hides top nav and enlarges the card grid (ESC to exit) |
KPI strip (flow: in · out · packets · ratio → hotspot → freshness)
| KPI | Meaning |
|---|---|
| Total in | Sum of each server's latest-point inbound bytes |
| Total out | Sum of each server's latest-point outbound bytes |
| Total packets | Sum of each server's last (in+out) packets · unit /window (not cumulative) |
| In:out | out ÷ in (1 decimal) shown as 1 : x. — when in is 0 |
| Top | Server with the largest latest outbound bytes (hotspot) |
| Active servers | Count of servers whose last point falls within 15 min of the window end / total. Warns (yellow) when below total |
Scale color legend + Y-axis scale
Line/area color encodes the magnitude of the value (ECharts visualMap piecewise). When a value crosses a threshold the color changes, so you feel the scale through color.
| tone | bytes | packets |
|---|---|---|
| info | < 1MB |
< 1K |
| good | 1–10MB |
1–10K |
| warn | 10–100MB |
10–100K |
| crit | > 100MB |
> 100K |
- Direction is encoded by line shape: outbound = solid line + heavier area, inbound = dashed line + light area. Also distinguished by the header arrows (↓ in / ↑ out) and the tooltip.
- Y-axis scale toggle:
linear(default, min pinned to 0 → honest area) |log(compresses KB–MB onto one axis so in and out are both visible). Selection persists tolocalStorage.
Server traffic cards
Each card = one server. The header shows the hostname plus current in/out bytes; the body is a 200px <metric-chart> (ECharts, dynamic-import) line chart.
- Drag reorder: use the grip (⋮) to reorder cards; the order persists under
infr:order:traffic-net. - Masonry layout + 12 cards per page.
- Fixed time axis: every card pins its X axis to
win.since ~ win.until(a shared window). Collection-lagged servers render honestly as a left-hand stub, avoiding a fake full-width curve stretched from a handful of points.
How to use
- Pick a range —
1hto chase spikes,24hfor daily patterns. - Switch metric —
bytesfor bandwidth load,packetsfor connection/PPS character. - Log axis — for servers with a large in/out disparity (web nodes where out ≫ in),
logkeeps both curves visible. - Reorder cards — drag servers of interest to the top (saved in the browser).
- Chase a hotspot — when you spot the KPI
Topserver or a crit (red) curve, jump to Port Connections / IP Connections to investigate which IP/port drove it.
The tooltip shows an
HH:MMheader plus each series value (in/out). Even on narrow cards, time-axis labels auto-hide to avoid overlap (hideOverlap).
Data sources
server_traffic (legacy_glory · read-only)
| Column | Purpose |
|---|---|
server_name, server_index |
Server identity |
time_window_start |
Collection window start (~300s = 5 min apart) |
direction |
inbound | outbound |
delta_bytes_count |
Byte delta for this window |
delta_packet_count |
Packet delta for this window |
The source query (TrafficRepository::serverTraffic) uses parameter binding to scan only a tight window (no hardcoding, no string interpolation):
SELECT server_name, server_index, time_window_start, direction,
       delta_packet_count, delta_bytes_count
FROM   server_traffic
WHERE  time_window_start >= :since   -- (latest window) − range
ORDER  BY time_window_start
LIMIT  6000;
Anchor = MAX(time_window_start) (indexed MAX → cheap). since = anchor − range minutes.
Minute-bucket normalization (sawtooth fix)
The
check_tx.jscollector stamps inbound and outbound with separatenew Date()calls inside its loop, so within the same 5-minute cycle thetime_window_startvalues differ by 1–2 seconds (e.g.:02in /:03out). Grouping by exact timestamp catches only one of in/out at each instant, leaving the other at 0 — producing a sawtooth chart.
Fix: SessionQueryService::reshapeNet rounds timestamps into a minute bucket (round(ts/60)*60) so in/out merge into a single point. The window interval (300s) is far larger than the bucket (60s), so adjacent windows never collide.
Display-timezone shift
Because the legacy DB store time can differ from display time (observed ~9h skew), values are shifted by OpsPolicy::trafficTzOffsetSec() for display only (stamp, time axis, series timestamps). The SQL boundaries (min/max) are NOT shifted — the query uses raw legacy time.
Cache · polling
- Server side
Cache::remember('infr:traffic:net:v1:<range>', 30, …)— 30-second cache. - Front end auto-polls every 30 seconds (
/infra/traffic/net/live?range=<minutes>).
Access
- Read-only screen. No writes, blocks, or other destructive actions.
- Being in the Infrastructure role area, it opens at minimum user_level 1 (demo=1); staff (5) and admin (10) of course also have access.
- The route is protected by the
infr.authmiddleware (session auth required). - Source credentials come only from
config('database.connections.legacy_glory')(i.e..env) — no credentials are hardcoded in the controller/service.
Troubleshooting & FAQ
Q. I only see "no traffic samples".
It means server_traffic has no recent window. Check that the check_tx.js collector is running and the legacy_glory connection is valid. When latestTrafficWindow() (MAX) is null, cards are empty and KPIs read 0.
Q. A server only draws a short stub on the left.
This is by design. The time axis is pinned to a shared window, so a collection-lagged server is drawn honestly up to its last observation as a left-hand stub. It is also counted as inactive in the Active servers KPI (last point falls outside 15 min of the window end).
Q. One direction's curve looks like a sawtooth.
Minute-bucket normalization fixes most cases, but if the collection windows themselves are irregular, some residual sawtooth may remain. Switching to the log axis smooths it.
Q. Are the values cumulative?
No. delta_* = increment per window (~5 min). That is why the Total packets KPI is labeled /window. These are not cumulative counters.
Q. The times are off by several hours.
The display timezone is corrected via OpsPolicy's traffic_tz_offset setting (see Operations Policy).
Related
- Port Connections — per-port/server TCP state distribution + top source IPs
- IP Connections — per-server remote peer IPs × port strength + IP deep-dive popup
- Servers (load time series) — load/CPU/MEM time series, same ECharts
<metric-chart>pattern - Health (node health) — per-node CPU rings + service dots
- Operations Policy — global settings such as
traffic_tz_offsetand monitored ports