Overview — what it does
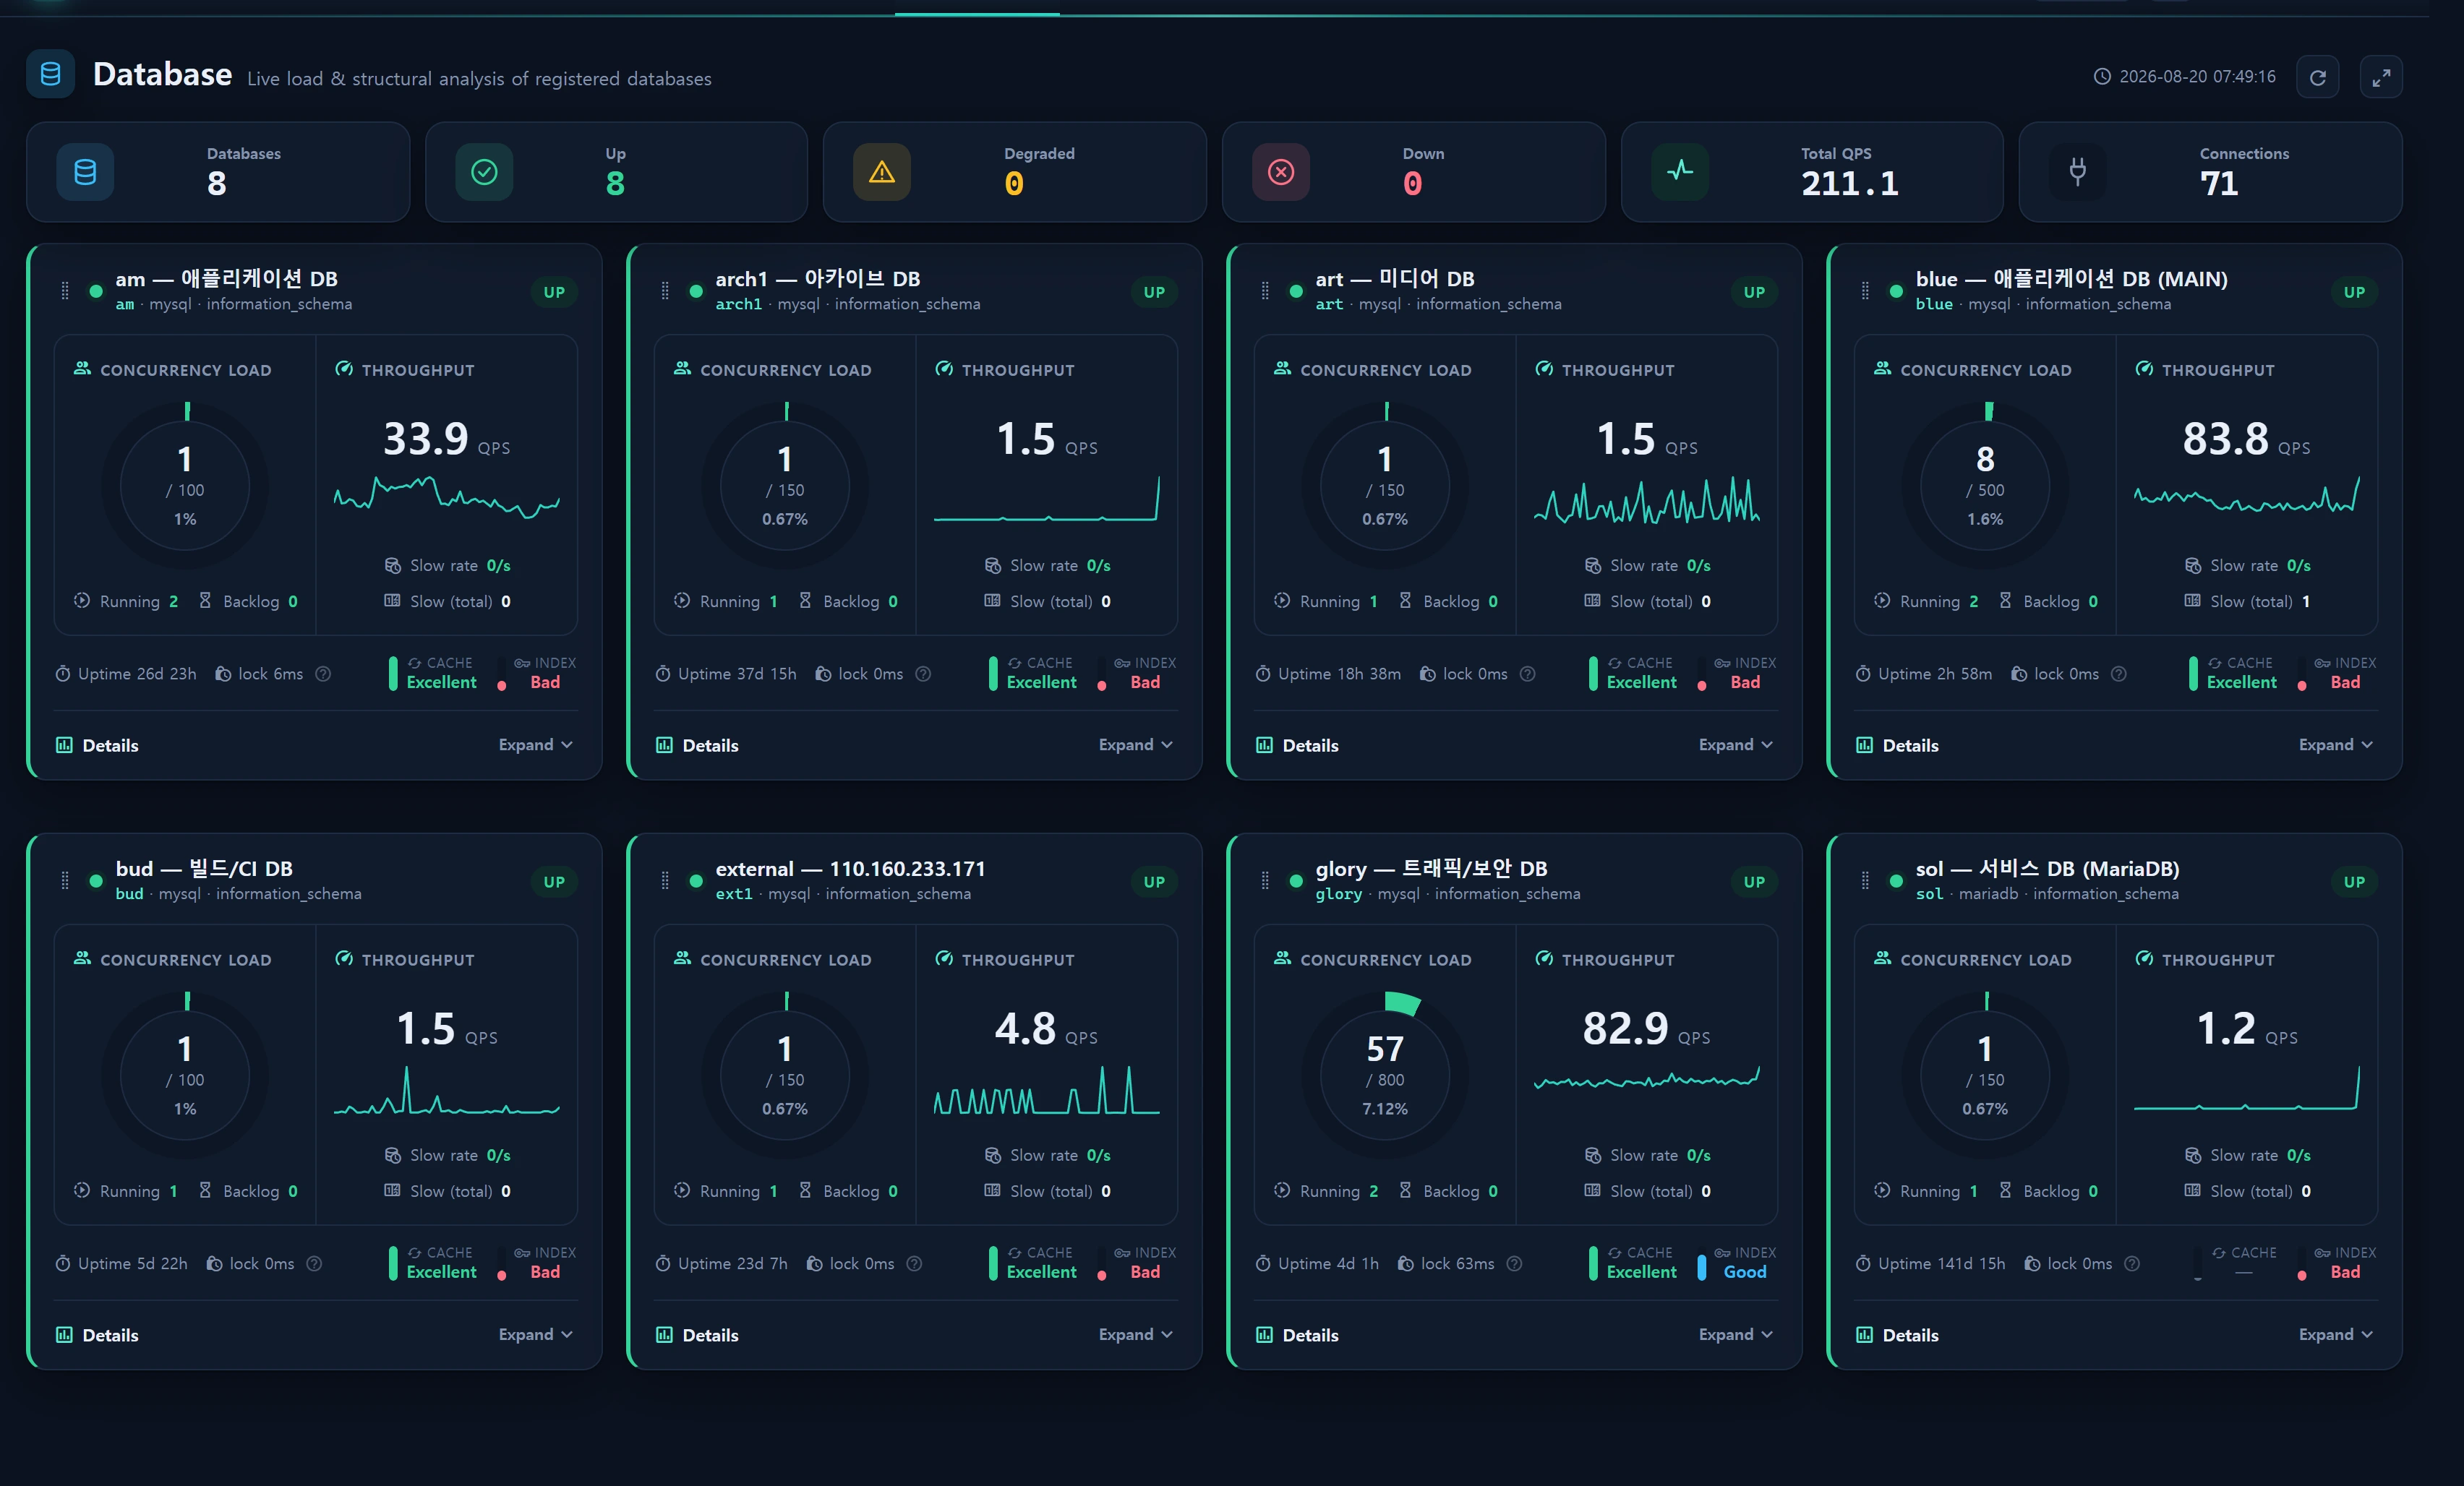
Service ▸ Database (/service/database) is a live monitoring screen that connects directly to registered database collectors (access=database) to sample load metrics and analyze schema structure. Each database is rendered as one card, and every card surfaces two load axes at a glance.
Database monitoring is built around two load axes:
| Axis | Question | Key metrics |
|---|---|---|
| ① Concurrency load | How much is piling up right now? | threads_running, connection saturation (conn_pct), waiting queries (waiting) |
| ② Throughput & inefficiency | How much work, and how much waste? | QPS (Δquestions/Δt), slow rate (Δslow_queries/Δt) |
On top of that it provides schema analysis (total size · top databases · largest tables · engine mix), efficiency scores (buffer-pool cache hit ratio · index usage), and an InnoDB memory management block (dirty page flush · checkpoint).
This screen installs no agent on the target DB. The InfraGuard app simply connects to the remote MySQL/MariaDB with the registered credentials and issues
SHOW GLOBAL STATUS/information_schemaqueries.
When to use
- A database suddenly got slow — instantly tell whether connections saturated, concurrency spiked, or slow queries grew.
- Before/after connection-pool tuning — watch
threads_connected / max_connectionssaturation over time. - Capacity planning — see which schemas/tables consume the most disk, and the engine mix.
- Diagnosing InnoDB flush pressure — whether dirty pages cycle healthily below the threshold, and how far checkpoint age has run ahead of redo capacity.
- Cache/index efficiency review — read buffer-pool hit ratio and index usage as tuning evidence.
Layout
Top KPIs
| KPI | Meaning |
|---|---|
| DB count | Total registered access=database collectors |
| Up / Degraded / Down | Aggregate of card status (up/degraded/down) |
| Total QPS | Sum of QPS across all cards |
| Connections | Sum of threads_connected across all cards |
Card header
- Host label (collector
host_alias→ config.host → cred_ref env host, in that order). - Driver (
mysql/mariadb), database name, uptime, status badge.
① Concurrency load
- Connection saturation ring gauge =
threads_connected / max_connections. - Running (
threads_running) — threads actually consuming CPU. - Waiting (backlog) (
waiting) — queries whose processing time exceeds the threshold (default 2s). Depending on thePROCESSprivilege, this counts server-wide or self-connection only (scope shown on the card).
② Throughput & inefficiency
- QPS sparkline =
Δquestions / Δt(last 60 successful samples). - slow rate =
Δslow_queries / Δt, and slow total (slow_queries).
Card footer — efficiency · lock
| Metric | Formula | Grades |
|---|---|---|
| Cache hit ratio | 1 − Δinnodb_buffer_pool_reads / Δinnodb_buffer_pool_read_requests |
Excellent ≥99.5% · Good ≥98% · Fair ≥90% |
| Index usage | Δhandler_read_key / (Δhandler_read_key + Δhandler_read_rnd_next) |
Excellent ≥90% · Good ≥70% · Fair ≥40% |
| lock | innodb_row_lock_time_avg (average row-lock wait, ms) |
Lower is better |
Each metric label (cache · index · lock · checkpoint) carries an educational popover explaining causes and remedies (e.g. raise innodb_buffer_pool_size, use covering indexes, avoid gap locks).
Schema analysis (collapsible)
Collapsed by default; expand with [Expand]. Aggregated from information_schema.tables, it shows total size · table count · schema count · top 8 schemas by size · top 14 tables by size · engine mix.
Schema analysis is an inherently slow query on the server (measured ~3.5s), so it is bypassed with a 30-minute long cache. The scheduler (
infr:collect-db) warms the cache, so web requests always hit it. When the cache is empty the section is briefly hidden, then appears on the next poll.
InnoDB memory management (dirty page flush)
- Dirty page time-series + a "proper value" (threshold) overlay — MAX (
innodb_max_dirty_pages_pct) and LWM (innodb_max_dirty_pages_pct_lwm) converted to absolute page counts (not arbitrary constants, but the point where InnoDB actually begins aggressive flushing). - Checkpoint age (
Log sequence number − Last checkpoint at) as a percentage of redo capacity. - Buffer-pool size and its ratio to server RAM (the alias-joined OS instance
mem_mb).
Card arrangement
The card grid supports drag-to-reorder (SortableJS · order persisted to localStorage) with row-span masonry. The screen refreshes on a 30-second poll.
How to use
- First register an
access=databasecollector under Administration ▸ Collectors. Enterhost/port/database/username+ password (stored Crypt-encrypted on the collector), or setcred_ref = env:PREFIXto reuse an existing.envcredential set. - Open
/service/database; registered databases list as cards. On entry, if the latest sample is older than 60 seconds an immediate one-shot sample (ensureFresh) is taken. - Identify a problem DB from the header status badge, then narrow the cause across the two load axes (concurrency / throughput).
- Expand schema analysis to inspect the largest schemas/tables (masonry re-lays-out automatically on height change).
- Drag cards to float the databases you care about to the top (order saved in the browser).
Reusing credentials via cred_ref
With cred_ref = env:PREFIX, the following keys are read from .env so no secret is stored in the DB:
For example: env:STATS_DB → blue server, env:STATS_GLORY_DB → glory server.
To see server-wide waiting queries
To aggregate waiting server-wide, the monitor account needs the PROCESS privilege; otherwise only its own connections are counted. A least-privilege monitor account:
CREATE USER 'infra_monitor'@'%' IDENTIFIED BY 'YOUR_DB_PASSWORD';
GRANT PROCESS, SELECT ON *.* TO 'infra_monitor'@'%';
FLUSH PRIVILEGES;
The scope decision (whether
PROCESSis held) is fixed per account, so it is cached for 1 hour. If you grant the privilege later, it takes effect within an hour (clear the cache for immediate effect).
Data sources
Origin queries (run on the remote DB)
| Query | Purpose |
|---|---|
SHOW GLOBAL STATUS |
All threads · questions · slow_queries · bytes · buffer pool · handler · InnoDB counters |
SELECT @@GLOBAL.max_connections etc. |
max_connections, InnoDB flush settings (1h cache) |
information_schema.processlist |
Waiting-query count + scope decision |
information_schema.tables |
Schema analysis (30-minute cache) |
SHOW ENGINE INNODB STATUS |
Checkpoint age (LSN − last checkpoint · requires PROCESS) |
SHOW GRANTS FOR CURRENT_USER() |
PROCESS privilege detection (scope) |
Storage table
Sampled data is written to the infr_db_metric time-series (migration 000681). Cumulative counters (questions/slow_queries/bytes_*) are also stored so the next sample can compute QPS · slow rate · efficiency scores by delta.
infr_db_metric
  collector_id  host  sampled_at  uptime_sec
  threads_connected/running/cached  max_connections  conn_pct
  waiting  waiting_scope
  questions  slow_queries  qps  slow_qps
  bytes_received/sent  recv_bps/sent_bps  innodb_row_lock_waits
  ok  message  raw(json: efficiency + InnoDB memory-management derivations)
No connection leaks (the [1040] lesson). Every sample builds a runtime connection and immediately
DB::purges it infinally. A PDO timeout (default 5s) keeps web requests and the scheduler from hanging on a slow remote. If this discipline breaks, the shared MySQLmax_connectionsis exhausted and even production is affected.
Collection schedule · gating
The time-series is filled by the artisan command infr:collect-db. It runs once and exits (not a daemon); the scheduler invokes it every minute.
# Take one immediate sample for a single collector (bypass the gate)
php artisan infr:collect-db --key=db@blue --force
Operations Policy (Administration ▸ Operations Policy · OpsPolicy) gates scheduled runs:
| Setting | Default | Meaning |
|---|---|---|
db_collect_mode |
economy |
economy = collect only when a console user (presence) exists · always = collect continuously |
db_collect_interval_sec |
60 |
Collection interval (s). Ticks every minute, but the effective period is this value |
degraded/down thresholds
DbCollectorService::statusOf decides status via OpsPolicy::dbThresholds().
| Reason | Condition | Default threshold |
|---|---|---|
conn_saturation |
conn_pct ≥ |
80% |
high_concurrency |
threads_running ≥ |
40 |
query_backlog |
waiting ≥ |
5 |
slow_query_rate |
slow_qps ≥ |
1/s |
down |
No sample / ok=false, or latest sample older than 5 minutes (stale) |
— |
Any reason present → degraded; none → up.
Access
- This screen is a read-only console inside the
infr.authgroup — minimum read level demo=1. - There are no write endpoints on this page. Register/edit target DB credentials in Administration ▸ Collectors (admin=10,
level≥5gate). - Change thresholds and collection mode in Administration ▸ Operations Policy (admin).
Troubleshooting & FAQ
A card shows "down"
no_credentials— config host/username is empty, or the env keys forcred_ref=env:PREFIXare missing.stale— the latest sample is older than 5 minutes. Check that the scheduler (infr:collect-db) is running and, in economy mode, that a console user is present.- Other message — the connection failure cause (auth denied, host unreachable, timeout) is shown verbatim. Diagnose with
php artisan infr:collect-db --key=<key> --force.
QPS / slow rate / efficiency scores show "—"
Derived values are computed as a delta against the previous successful sample. On the first sample, after a DB restart (uptime decreased → counter reset), or when a counter regresses, the value is untrustworthy and left null (—). It appears normally from the second sample on.
Waiting queries show "self-connection only"
The monitor account lacks the global PROCESS privilege, so only its own connections are visible in information_schema.processlist. Grant PROCESS with the SQL under To see server-wide waiting queries (effect within one hour, when the scope cache expires).
The memory management / checkpoint section is empty
- Memory management requires
innodb_buffer_pool_pages_total(hidden for older samples). - Checkpoint age is parsed from
SHOW ENGINE INNODB STATUS(→ needsPROCESS). Without the privilege the checkpoint line and annotation are gracefully omitted.
Schema analysis blinks empty then appears
analysisCached is a cache-only lookup. On first entry the cache is empty and the section is hidden; after the scheduler warms it, it appears on the next 30-second poll. Failures are cached for only 30s (successes for 30 minutes) so a transient error is not pinned for long.
Related
- DB load & tuning education — background for the lock · cache · index · checkpoint popovers.
- Collectors — registering
access=databasecollectors, secrets, cred_ref. - Operations Policy — collection mode · interval · degrade thresholds.
- Sessions (Redis) — the sister screen applying the same methodology to Redis.
- Service Overview — where DB cards are summarized on the live service board.
- DB collector pipeline — collection command and connection-leak discipline.