Overview — what it does
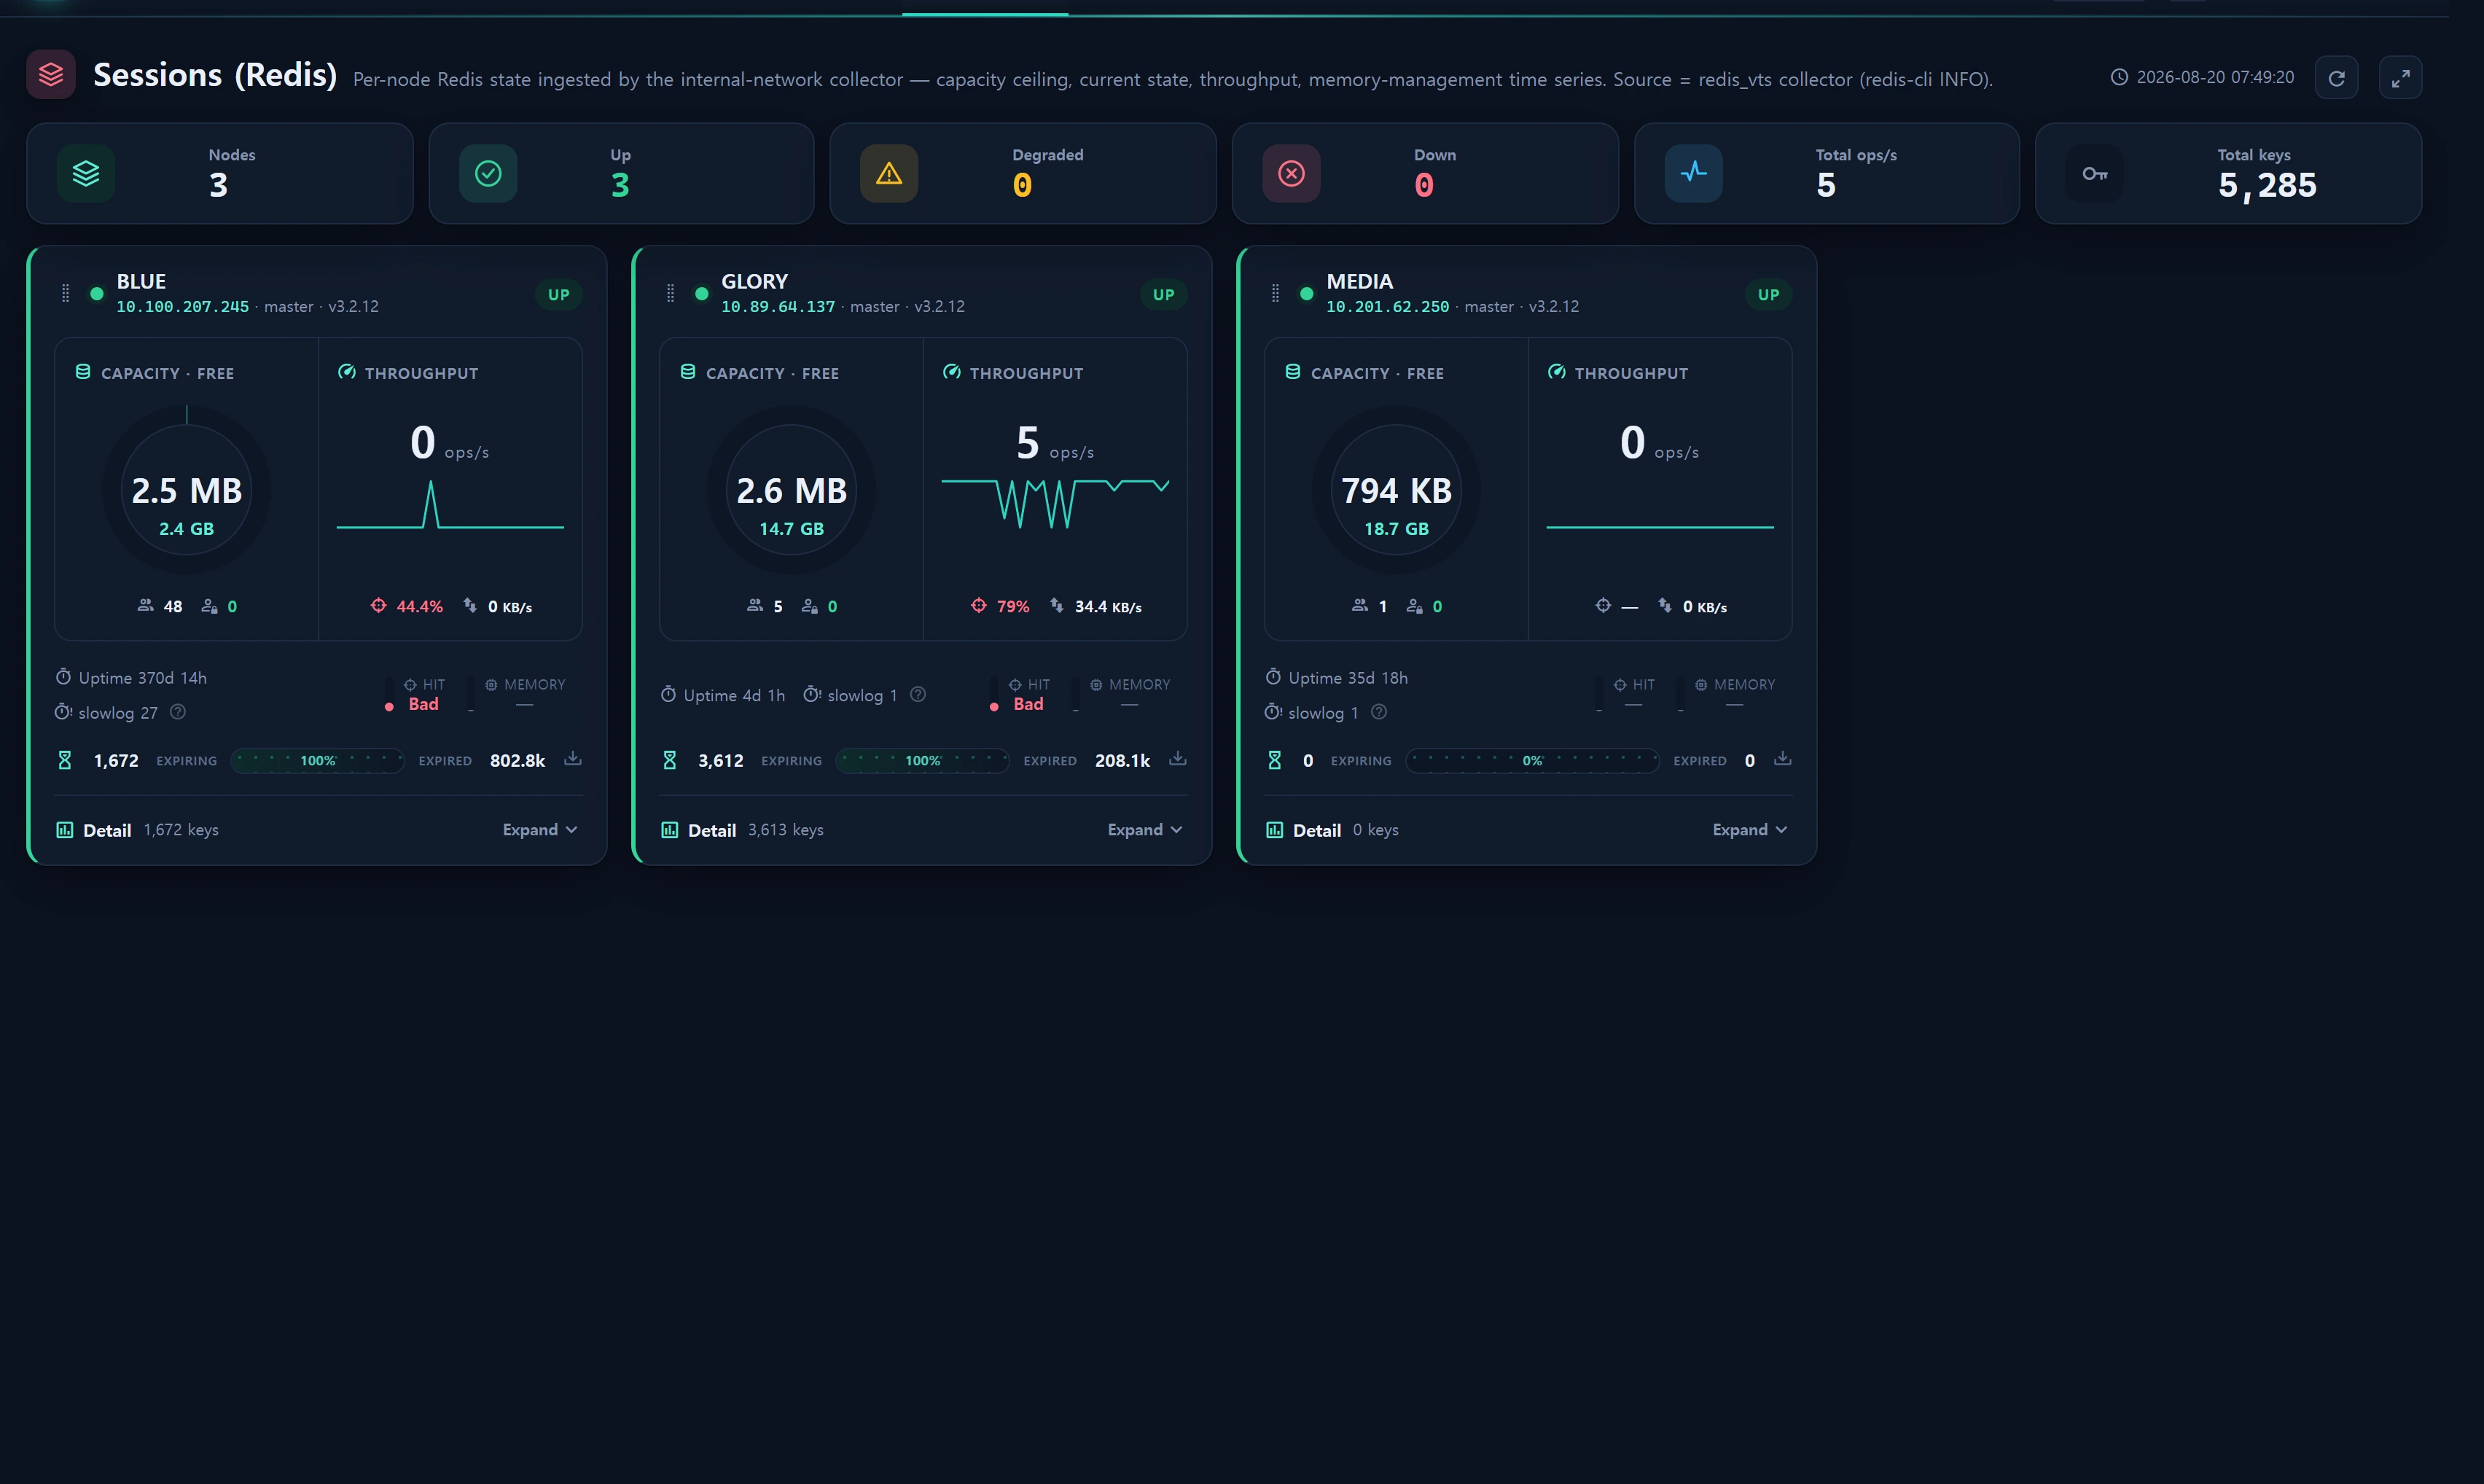
Service ▸ Sessions (Redis) monitors the session/cache store health of your registered Redis nodes on one screen. It mirrors the Service ▸ Database narrative onto Redis, reading around two axes:
- Capacity ceiling + current state — a memory-saturation ring gauge (
used_memory÷ capacity ceiling), client connections (connected / maxclients), and blocked clients. - Throughput — operations per second (
instantaneous_ops_per_sec), recent-window hit rate (Δhits / Δ(hits+misses)), and network I/O (in/out kbps).
A collapsible details panel adds a memory-management time series (capacity-ceiling overlay + eviction-episode pins) and keyspace/session analysis.
This screen never connects to Redis directly. An internal-network representative collector (
scripts/infr_redis_vts_collector.cjs, a pm2 cron running every minute) runsredis-cli INFOon each node and loads snapshots into the central MySQL tableinfr_redis_metric; the app only reads it. The app holds no Redis credentials and runs no long-lived daemon (avoiding connection-leak and hard-coded-credential traps).
When to use
- Session-store capacity — spot Redis memory nearing the ceiling, where sessions get evicted (lost) under pressure.
- Cache-efficiency diagnosis — judge whether the cache is doing its job via hit rate, fragmentation, and slowlog.
- Connection saturation — act before new connections are rejected when
connected_clientsapproachesmaxclientsorrejected_connectionsclimbs. - Persistence/replication faults — see RDB bgsave failure, AOF rewrite, or replica link-down as badges.
- Session lifetime — distinguish expiry (normal lifetime) from eviction (memory pressure) to read session churn.
Layout
Top KPIs
| KPI | Meaning |
|---|---|
| Nodes | Redis node cards with a sample in the recent (30 min) window |
| Up / Degraded / Down | Counts of up / degraded / down nodes |
| Total ops/s | Sum of instantaneous_ops_per_sec across nodes |
| Total keys | Sum of keyspace_keys across nodes |
Node cards (two axes)
Each node is one card. The header shows instance name/alias, Redis version, and role (master/replica); the body carries the two axes.
① Capacity · free (left ring gauge) — center value = used_pct (used ÷ capacity ceiling). Metric strip:
| Metric | Field | Notes |
|---|---|---|
| Clients | connected_clients / maxclients |
Connections vs limit; near the limit, new connections are rejected |
| Blocked | blocked_clients |
Clients waiting on BLPOP·BRPOP·WAIT (0 is healthy) |
② Throughput (right) — sparkline + strip:
| Metric | Field | Notes |
|---|---|---|
| ops/s | instantaneous_ops_per_sec |
Commands processed per second |
| Hit rate | Δhits / Δ(hits+misses) | Recent-window cache hit rate (falls back to lifetime when samples are sparse) |
| net I/O | instantaneous_input_kbps + output_kbps |
Network in/out per second |
Efficiency scores (card foot)
- Hit rate grade — Excellent ≥99% · Good ≥95% · Fair ≥80%.
- Memory efficiency (fragmentation) grade — Excellent 0.95–1.4 · Good ~1.6 · Fair ~2.5.
The fragmentation score (
frag_score) is only computed whenused_memoryis at least 64 MB. On small instances fixed allocator overhead dominates the ratio and produces false alarms, so below that threshold it is excluded from both scoring and status.
Session-lifetime flow strip
A full-width strip along the card foot renders expiring → flow → cumulative expired. Left = keys with a live TTL right now (keyspace_expires, soon to expire naturally); right = keys expired since uptime (expired_keys, the session churn). A fill near ≈100% means a pure session store.
Details (expand)
Two blocks open collapsibly (the masonry layout re-flows on height changes).
- Memory management —
usedvs capacity time series + a capacity-ceiling 100% cut line overlay + eviction-episode crit pins. The card lists the capacity ceiling (cap), estimated free (est_free), total RAM, DB reservation, OS reserve, peak, RSS, fragmentation, cumulative eviction/expiry, and the eviction policy. - Keyspace · sessions — total keys, TTL-bearing keys, logical-DB (db0/db1…) distribution bars, the session DB highlighted, average TTL, and RDB/AOF/replica persistence badges.
Educational popovers (edu)
Hovering the icon next to a metric opens a designed popover explaining causes and remedies (deeper concepts in Redis Tuning Explained):
| Popover | Content |
|---|---|
| SLOWLOG | 7 causes of accumulating slow commands (O(N) commands · big keys · memory pressure · fork stalls · Lua · pipelines · large DEL) |
| Hit rate | keyspace hit-ratio basis + how to raise it (keep working set resident · tune TTL · mitigate stampedes) |
| Fragmentation | RSS / used healthy band (1.0–1.5) · activedefrag · swap (<1.0) warning |
| Logical DBs | Redis numbered DBs (0–15) concept · per-purpose split · Cluster portability |
| Expiry · eviction | Expiry (normal lifetime) vs eviction (memory pressure) · how to read |
How to use
- Polling — after load the page polls
/service/session/liveevery 30 seconds to refresh KPIs and cards (the server caches the dashboard for 20 seconds). - Reorder cards — drag cards into priority order (SortableJS; order persists in localStorage).
- Expand details — use the card's [Expand] to open the memory-management and keyspace blocks.
- Learn via edu — hover a metric icon to see the cause/remedy popover.
- Fullscreen — the fullscreen button next to the header LIVE indicator hides the top nav and switches to dashboard mode (ESC to exit).
If there are no cards, no Redis nodes have been registered/collected yet. In Administration ▸ Collectors, register
redis_hostnodes on theredis_vtscollector and deploy the collector via pm2 on the representative host.
Data sources
Read-model infr_redis_metric
The app maps this table as a read-only, Legacy-style model (App\Models\Infr\InfrRedisMetric, $timestamps=false). There is deliberately no migration for it — the collector self-provisions it with CREATE TABLE IF NOT EXISTS, so an app-side Schema::create would collide.
Builder App\Services\Redis\RedisMetricService::dashboard() discipline:
- Queries the recent 30-minute window (
WINDOW_MIN) in a single batch query, then groups bynode_alias(one card per node). If the window has no samples (collection stopped), it pulls at least the last 180 rows to expose nodes asstale. - Time series are truncated to the last 60 points per card (
SERIES_MAX). Cumulative counters (evicted/expired) become rates via adjacent-sample deltas; on reset (a decrease) the rate isnull. - The dashboard result is cached for 20 seconds (
infr:redism:dash:v1).
-- Conceptual (actually Eloquent). Batch the recent window, group in PHP.
SELECT * FROM infr_redis_metric
 WHERE sampled_at >= (NOW() - INTERVAL 30 MINUTE)
 ORDER BY sampled_at;
Collector — scripts/infr_redis_vts_collector.cjs
A single internal-network representative host runs on a pm2 cron, sweeping several nodes' Redis (redis-cli -h {ip} INFO) and nginx vts once per run, loading directly into central MySQL, then exiting (not resident → a fresh process per run, no leaks). Configuration lives only in the CONFIG block at the top of the file (no env, no hard-coded credentials).
# Deploy on the representative host (sweep every minute, not resident)
npm i mysql2                 # the only npm dependency (for loading). Install redis-cli via OS package.
pm2 start infr_redis_vts_collector.cjs --name infr-collector \
  --no-autorestart --cron-restart "* * * * *"
pm2 save
Instance join (alias / int FK)
At write time the collector looks up node alias→id in infr_instance and writes an instance_id (int) directly. The app joins primarily on metric.instance_id = infr_instance.id (integer comparison — collation-agnostic, PK-indexed). Unregistered or late-registered instances fall back to node_alias (lowercased) → infr_instance.alias, and the infr:link-metrics backfill (leader-gated, every 5 min) later fills instance_id.
Capacity ceiling (cap) computation
The 100% baseline of the ring gauge and memory chart is resolved in this order.
| cap kind | Condition | Ceiling | Estimated free (est_free) |
|---|---|---|---|
maxmemory |
maxmemory > 0 |
The maxmemory setting (hard ceiling) | maxmemory − used |
budget |
maxmemory unset | Total RAM − DB buffer pool − OS reserve | budget − used |
- Total RAM =
total_system_memory(collected), falling back toinfr_instance.mem_mb. - OS reserve = Total RAM ×
redis_reserve_pct(default 20%). - DB buffer pool = the same node's latest
access=databasecollectorinfr_db_metric.raw.bp_size(summed if a node hosts multiple DBs). Subtracting it yields the budget Redis can realistically use as the ceiling. - The budget is floored so it never drops below current
used, preventing negatives/inversion.
Status determination & thresholds
statusOf() classifies each node as up / degraded / down.
| Status | Condition |
|---|---|
down |
Collection failed (ok=0) or stale (last sample older than redis_stale_min) |
degraded |
One or more of the reasons below |
up |
No reasons |
degraded reasons and thresholds (Administration ▸ Operations Policy, infr_setting group=ops):
| Reason | Condition | Threshold key | Default |
|---|---|---|---|
| Memory saturation | used_pct ≥ |
redis_mem_pct |
85 |
| Fragmentation | frag_score ≥ |
redis_frag_ratio |
1.6 |
| Blocked clients | blocked_clients ≥ |
redis_blocked |
1 |
| Replica link down | master_link_status = down |
— | — |
| RDB save failed | rdb_last_bgsave_status = err |
— | — |
Hit rate is NOT a status axis. A session store misses on every new login, expiry, and logout, so a 40–60% hit rate is normal (e.g. 44.75% on a perfectly healthy session node). Earlier a hit rate below
redis_hit_rate_min(default 50) produced a false-reddegraded; now hit rate is only displayed on the card KPI, grade gauge, and edu popover and never colors a node red. Real cache problems (memory saturation, eviction, fragmentation) are caught bymem_saturation/fragmentationregardless of workload.
Access
- Read (this screen) —
user_level ≥ 1(demo=1). The Service role area has a minimum level of 1, and this screen is read-only (no write/delete actions). - Collector register/edit — Administration ▸ Collectors requires
user_level ≥ 5(staff/admin) to registerredis_hostnodes and passwords on theredis_vtscollector. - Threshold changes — Administration ▸ Operations Policy requires
user_level ≥ 5.
This screen has no destructive action, so it writes no audit log of its own (collector and policy changes are audited on their respective admin screens).
Troubleshooting & FAQ
No cards appear ("No Redis nodes collected")
infr_redis_metric has no recent samples. Check that (1) you registered redis_host nodes on the redis_vts collector in Administration ▸ Collectors, (2) infr_redis_vts_collector.cjs is running under pm2 on the representative host, and (3) the representative host can reach each node's Redis port via redis-cli.
A node shows "Down (stale)"
The last sample is older than redis_stale_min (default 5 min). The representative collector's pm2 process likely died or its cron stopped. Inspect with pm2 list / pm2 logs infr-collector.
The ring gauge ceiling looks off / free space seems huge
Nodes without maxmemory use a budget as the ceiling (Total RAM − DB buffer pool − 20% OS reserve). For a hard ceiling, set maxmemory on Redis — that value then becomes the ceiling directly.
The keyspace/session block is empty
Per-DB detail (raw.keyspace) and session-DB metrics are populated by the extended collector. On an older collector, redeploy (which idempotently adds total_system_memory, keyspace_keys, and per-DB raw columns) and it appears. If uncollected, the section hides gracefully.
The hit rate is low — is that a problem?
For a session workload, no (see the warning above). If it is a pure cache and the hit rate is low, the working set may not be resident or the TTL may be too short — see the hit-rate topic in Redis Tuning Explained.
The fragmentation score is not shown
When used_memory is under 64 MB the fragmentation ratio is dominated by fixed overhead and is meaningless, so it is excluded from scoring and status.
Related
- Database (Service ▸ Database) — the sibling screen implementing the same narrative (capacity · throughput · schema) for MySQL
- Redis Tuning Explained — deeper dive on slowlog, hit rate, fragmentation, keyspace, and eviction
- Collectors (Administration ▸ Collectors) — register the
redis_vtscollector and its nodes - Operations Policy (Administration ▸ Operations Policy) — set Redis status thresholds and the reserve percentage
- Service Overview (Service ▸ Overview) — pin session cards onto the priority board