Overview — what it does
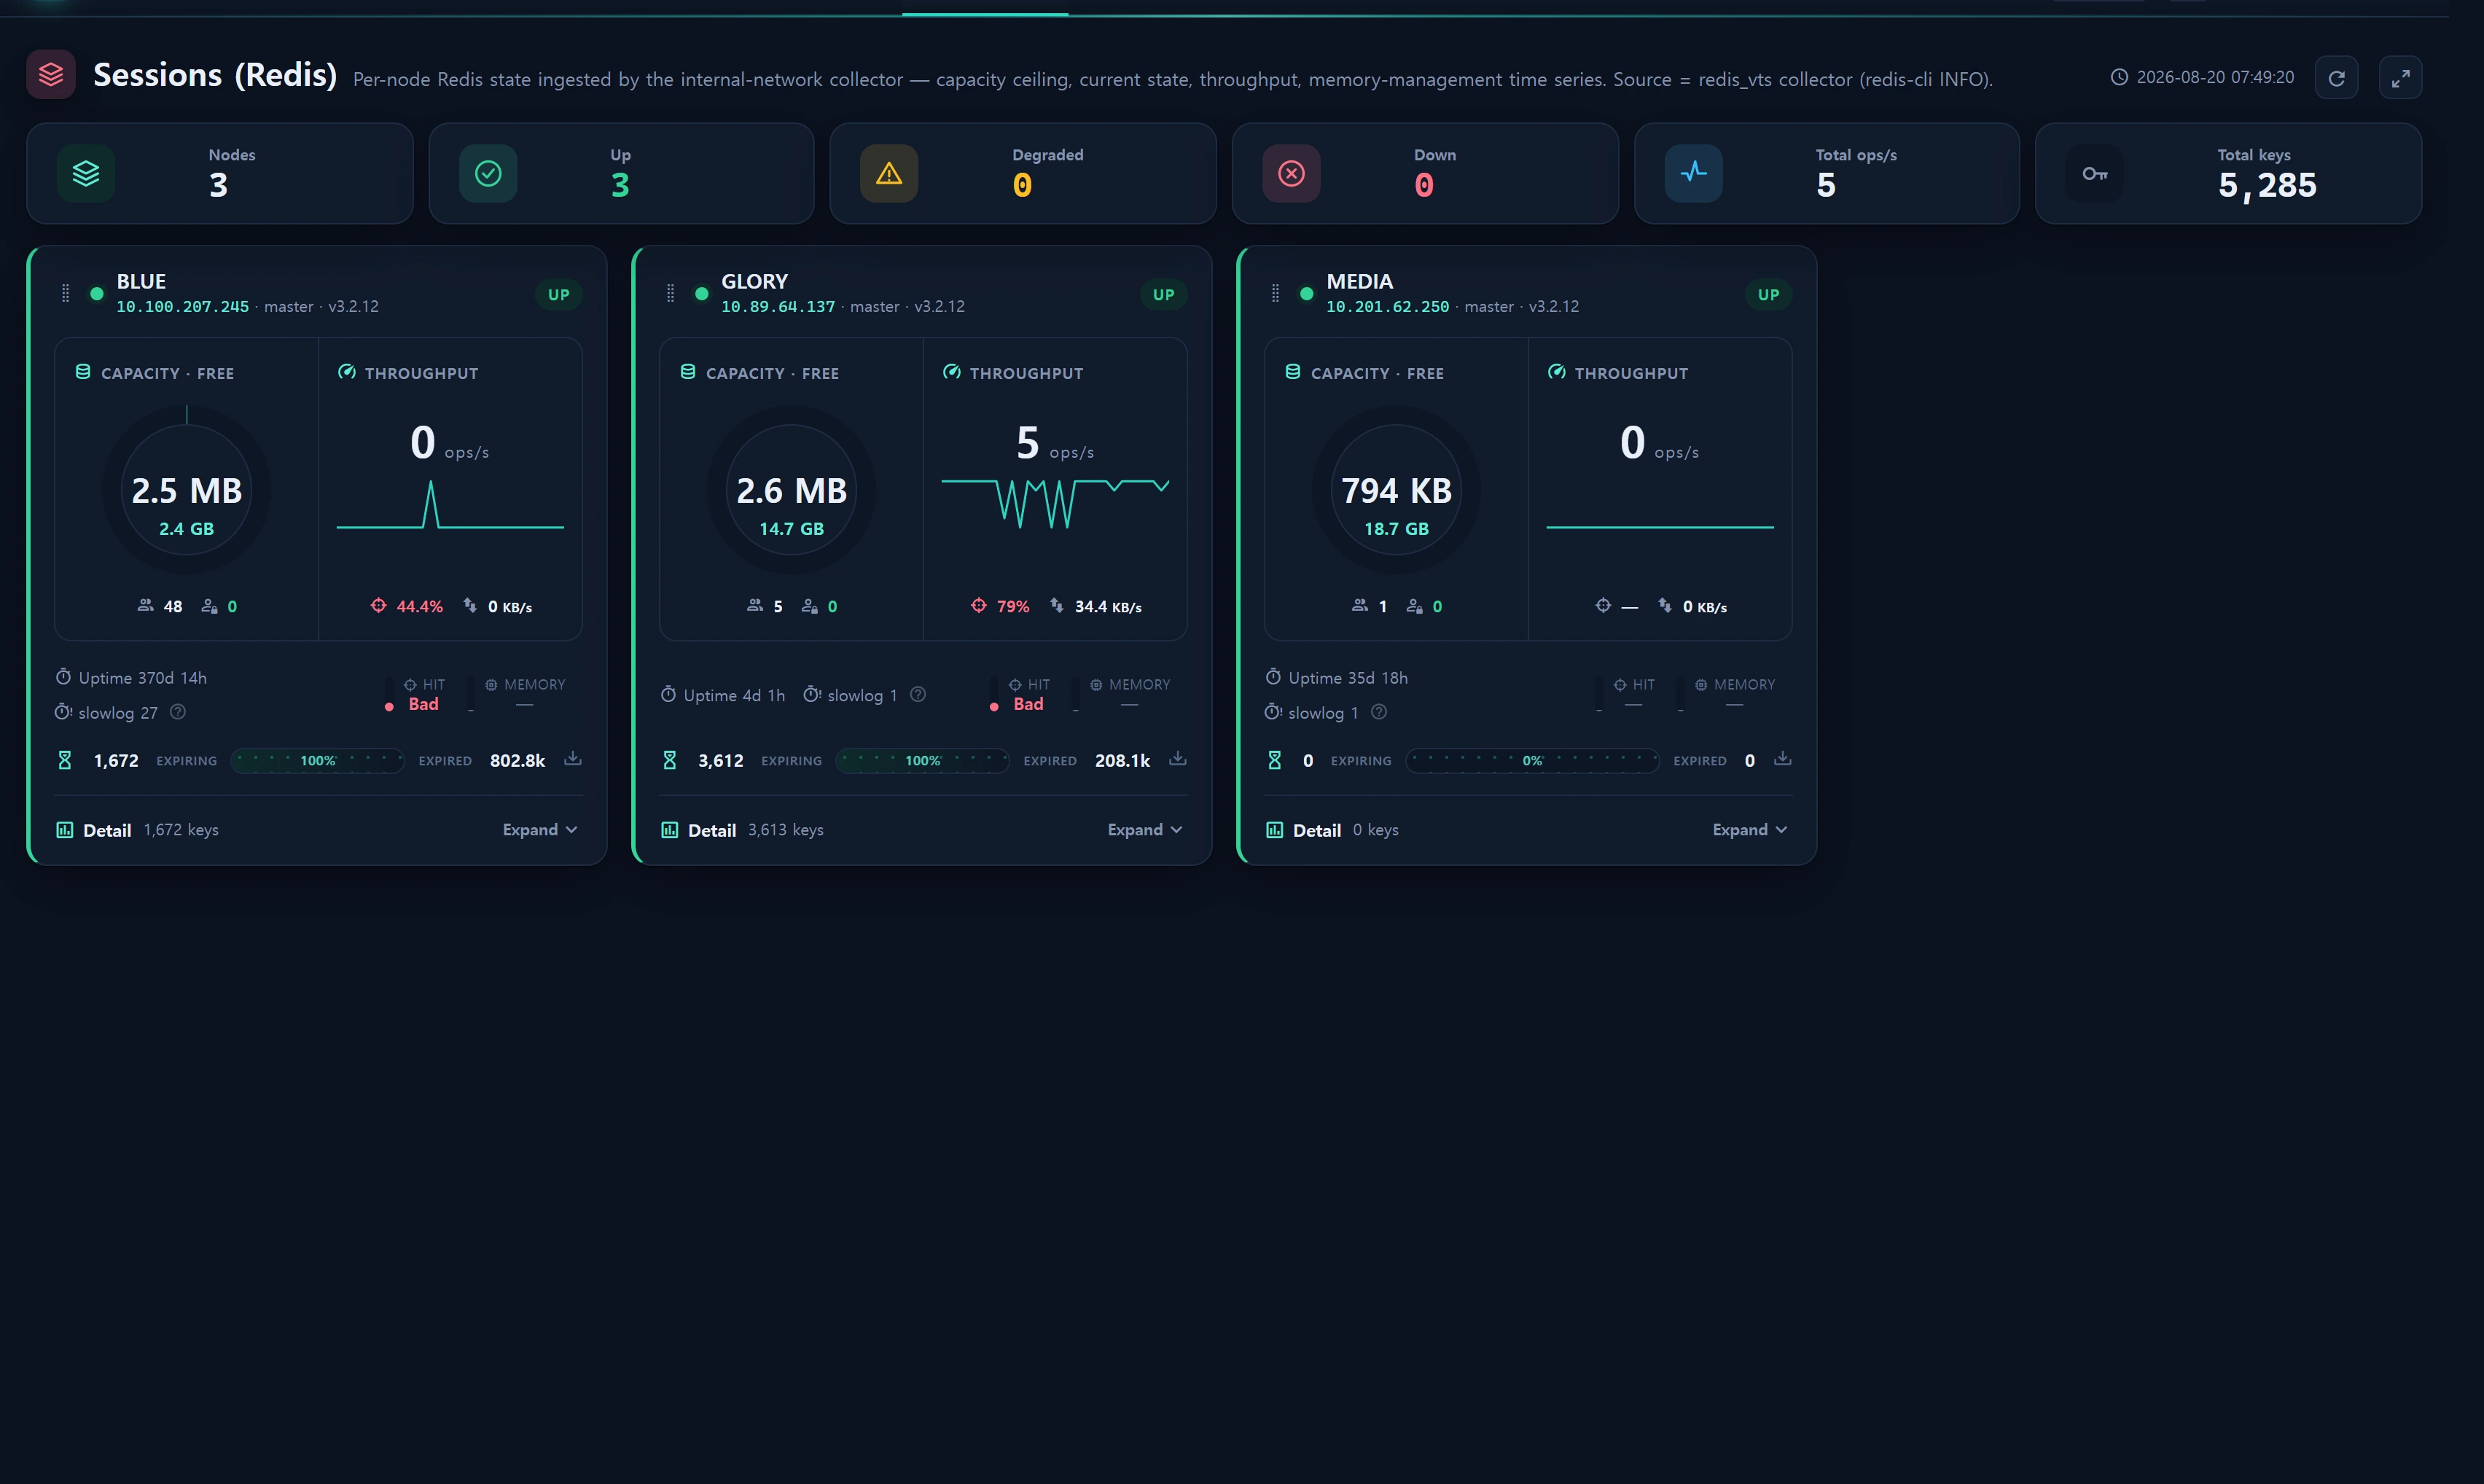
This article teaches how to read and act on the metrics you see on the Service ▸ Sessions (Redis) screen (/service/session). That screen is a live monitoring console; this page explains the Redis operations concepts behind it — slowlog, keyspace hit ratio, memory fragmentation, and expiry vs eviction.
InfraGuard never connects to Redis directly. An internal-network representative collector (scripts/infr_redis_vts_collector.cjs, run under pm2 as a per-minute cron) takes a redis-cli INFO snapshot from each node and writes it to the central MySQL table infr_redis_metric; the app only reads that table. Every value here therefore comes from standard INFO fields.
The exact lexicon and improvement tips for each metric live single-sourced in the education popovers (on hover) of the Sessions screen (
edu.*inresources/lang/{ko,en}/redis.php). This article summarizes and connects those concepts rather than re-defining them — hover the live popovers for the full detail.
When to use
- A session card turned Degraded / Down and you want to understand the reason code (
mem_saturation,fragmentation,blocked_clients,replica_link_down,rdb_save_failed,stale). - The hit rate looks low but the node seems fine (deciding whether it's normal for a session store).
- The fragmentation ratio rose above 1.5 or fell below 1.0 and you want cause + remedy.
- Eviction started climbing above 0 and you fear session loss.
- The slowlog keeps growing and you need to find which command pattern to fix.
Layout
One session card represents one node (node_alias = infr_instance.alias, 1:1) and inherits the Service ▸ Database narrative.
| Region | What it shows | Source INFO fields |
|---|---|---|
| ① Capacity · Free | Memory capacity ring (used / cap) · clients (connected/max) · blocked | used_memory, maxmemory, total_system_memory, connected_clients, maxclients, blocked_clients |
| ② Throughput | ops/s spark · recent-window hit rate · net I/O | instantaneous_ops_per_sec, keyspace_hits/misses, instantaneous_input/output_kbps |
| Foot efficiency | Hit-rate grade · memory (fragmentation) grade | hit_rate, mem_fragmentation_ratio |
| Session lifetime flow | Expiring (with TTL) → flow → expired total | keyspace_expires, expired_keys |
| Detail (collapsible) | Memory-management time series + capacity ceiling overlay + eviction-episode pins · keyspace/session analysis | used_memory series, evicted_keys, INFO keyspace |
Top KPIs: node count · Up/Degraded/Down · total ops/s · total keys · client sum.
How capacity (the ceiling) is determined
The 100% reference (budget) for the ring gauge and memory chart is chosen in this order:
- If
maxmemoryis set, that is the hard ceiling (Redis enforces it). Estimated free =maxmemory − used. - If unset (unlimited), budget =
total RAM − DB buffer pool − OS/other reserve (%). Reserve defaults to 20% (Operations Policyredis_reserve_pct); the DB buffer pool is subtracted from the same node'saccess=databasecollector.
A
maxmemory 0(unlimited) node shows a "maxmemory unset — shown relative to OS/server RAM" note. For a dedicated session instance, set an explicitmaxmemory(a fraction of OS RAM) so the eviction policy behaves predictably.
How to use
1) slowlog — why it grows (7 causes summarized)
Redis is single-threaded, so one slow command blocks the whole server. slowlog_len is the running count of commands exceeding slowlog-log-slower-than (default 10ms). Most common first:
- O(N) commands —
KEYS *,SMEMBERS,HGETALL,LRANGE 0 -1scan whole collections. The top cause. - Big-key operations — multi-MB Strings or large Hash/Set/ZSet serialization + transfer cost.
- Memory pressure / swap — allocation stalls as used nears the cap.
- Persistence fork latency — RDB
bgsave/ AOF rewritelatest_fork_usec. - Heavy Lua/function scripts — a heavy
EVALblocks while it runs. - Large pipelines / MULTI — thousands of commands at once queue the rest.
- DEL of large keys — use async
UNLINKinstead ofDEL.
Confirm which commands actually fired directly on the node:
# Last 10 slow commands (redis-cli)
redis-cli SLOWLOG GET 10
# Threshold + retained count (microseconds · e.g. 10ms)
redis-cli CONFIG SET slowlog-log-slower-than 10000
redis-cli CONFIG SET slowlog-max-len 128
redis-cli SLOWLOG RESET
Never run
KEYS *in production — while it scans the whole keyspace, every other command waits. Replace it with the cursor iteratorsSCAN/HSCAN/SSCAN/ZSCAN.
2) Keyspace hit ratio — low is not a defect
Recent-window hit rate = Δkeyspace_hits / (Δhits + Δmisses). When the sample is thin (delta denominator < 20) it falls back to the lifetime hit_rate. Grades: Excellent ≥99% · Good ≥95% · Fair ≥80%.
Hit rate is NOT a status axis that turns a node red. A session store is inherently low-hit — every new login, expiry, and logout is a miss, so 40–60% is normal (e.g.
blueat 44.75% is a perfectly healthy session node). That is why, even though aredis_hit_rate_minthreshold (default 50) exists, it is not used for status — it is shown for interpretation only. Real cache trouble is caught, workload-independently, by memory saturation / eviction / fragmentation below.
To actually raise hit rate: keep the working set resident (RAM/maxmemory headroom), right-size TTLs, mitigate cache stampede (jittered TTLs), and pre-warm miss-heavy prefixes. See the live hit popover for details.
3) Memory fragmentation — healthy band 1.0 to 1.5
mem_fragmentation_ratio = used_memory_rss / used_memory — physical memory the OS gave Redis vs what Redis actually uses.
| Ratio | Meaning | Action |
|---|---|---|
| 1.0 – 1.5 | Healthy band | Normal |
| > 1.5 | Fragmented (RAM wasted) | activedefrag yes (needs jemalloc), reduce frequent create/delete of large values |
| < 1.0 | Swapping (danger) | Immediately add RAM or lower maxmemory to stop swap — a sharp-slowdown signal |
Grades: Excellent 0.95–1.4 · Good ~1.6 · Fair ~2.5. Status threshold redis_frag_ratio defaults to 1.6.
On a small instance where
used_memoryis below 64MB, fixed overhead dominates the ratio and the fragmentation number becomes a false positive. InfraGuard excludes fragmentation from scoring in that case (frag_score = null) — it still displays the value but does not turn the node red.
4) Expiry vs eviction — the heart of session lifetime
| Term | Meaning | Signal |
|---|---|---|
| Expired (expired_keys) | TTL elapsed, natural removal = normal session lifetime | Turnover · usually normal |
| Evicted (evicted_keys) | Forced removal at maxmemory per policy |
Memory pressure · session-loss risk |
In a session store, expiry is normal, but sustained eviction above 0 means live sessions are being dropped. Respond by:
- Eviction rate > 0 → add RAM / raise
maxmemory. - Check the policy:
allkeys-lruevicts sessions too;volatile-*only evicts keys with a TTL. - If
rejected_connectionsrises alongside, you hitmaxclientsand the memory limit at once.
# Inspect / change the eviction policy
redis-cli CONFIG GET maxmemory-policy
redis-cli CONFIG SET maxmemory-policy volatile-lru
# Online defrag (for fragmentation > 1.5 · needs jemalloc)
redis-cli CONFIG SET activedefrag yes
The detail memory-management chart overlays a 100% capacity-ceiling line on used_pct and marks eviction episodes with crit pins — so you can visually trace when the node touched the ceiling and dropped sessions.
5) Reading logical DBs (keyspace)
INFO keyspace reports the key counts of numbered, independent key spaces (logical DBs, 16 by default, index 0–15).
# INFO keyspace example
db0:keys=48213,expires=48213,avg_ttl=1680000
db1:keys=126,expires=0,avg_ttl=0
The DB with the most keys is the main session store, and if that DB's keys = expires (all with TTL) it is a pure session store (keys lapse naturally). Above, db0 reads as sessions (all TTL) and db1 as another use (cache/locks).
Data sources
| Item | Value |
|---|---|
| Source table | infr_redis_metric (central MySQL · read-only read-model, $timestamps=false) |
| Feeding collector | scripts/infr_redis_vts_collector.cjs (pm2, per minute) — redis-cli INFO |
| Provisioning | Collector self-creates via CREATE TABLE IF NOT EXISTS (no migration) |
| Join key | instance_id (integer FK first) → fallback node_alias ↔ infr_instance.alias |
| Builder | App\Services\Redis\RedisMetricService (single batch query · 20s cache) |
| Recent window | 30 min (WINDOW_MIN) · up to 60 chart points · 30s polling (/service/session/live) |
| Threshold SOT | App\Support\OpsPolicy::redisThresholds() |
Status thresholds (Operations Policy infr_setting group=ops):
| Key | Default | Verdict |
|---|---|---|
redis_mem_pct |
85 | capacity(%) ≥ → Degraded (mem_saturation) |
redis_frag_ratio |
1.6 | fragmentation ≥ → Degraded (fragmentation, only when used ≥ 64MB) |
redis_blocked |
1 | blocked clients ≥ → Degraded (blocked_clients) |
redis_stale_min |
5 | last sample older than N min → Down (stale) |
redis_hit_rate_min |
50 | display/interpretation only (not used for status) |
redis_reserve_pct |
20 | OS/other reserve (%) for the estimated-free calc |
master_link_status=down(replica link down) andrdb_last_bgsave_status=err(RDB save failed) are also caught as Degraded reasons. Per-DB keyspace detail,total_system_memory, and key totals are collector extension columns — on an older collector those sections hide gracefully ("shown after collector redeploy").
Access
- Read (view the Sessions screen): Service role area
min_req 1— any signed-in user (demo=1 and up). The screen is read-only, so there is no write gate (no direct Redis connection or write command). - Edit thresholds: adjust the
redis_*values in Operations Policy — adminlevel≥5(admin=10,infr.levelgated). - Register the collector: adding redis_host nodes to the redis_vts collector is done in Collectors at
level≥5.
Troubleshooting & FAQ
Q. It only shows "No Redis nodes collected yet."
A. infr_redis_metric is empty. Register redis_host nodes on the redis_vts collector in Administration ▸ Collectors, and deploy scripts/infr_redis_vts_collector.cjs under pm2 on the representative host. The collector creates the table via CREATE TABLE IF NOT EXISTS and ingests every minute.
Q. A node stays Down with reason stale.
A. The last sample is older than 5 min (redis_stale_min) — the pm2 collector died (pm2 ls), or network/redis-cli access to the node is blocked. Check the collector logs.
Q. The keyspace/session analysis and memory-ceiling sections are missing.
A. total_system_memory, per-DB keyspace, and key-total columns are collector extensions. On an older collector these are null, so the sections hide — redeploy the latest collector to reveal them.
Q. Hit rate is 45% — why isn't it Degraded? A. By design. A session store is normally low-hit, so hit rate never marks a node Degraded. Real problems (memory saturation, eviction, fragmentation) are caught on separate axes.
Q. Fragmentation shows 3.0 but the instance is tiny.
A. When used_memory is below 64MB, fixed overhead skews the ratio. InfraGuard excludes fragmentation from scoring in that case — treat the value as informational. Unless it is actual swapping (<1.0), there is little to worry about.
Related
- Sessions (Redis) screen — the live console that applies these concepts
- Database load monitoring — the DB monitor that follows the same narrative (connections, QPS, slow query)
- DB tuning concepts (education) — locks, cache, indexes on the DB side
- Operations Policy — edit the
redis_*thresholds and reserve percentage - Collectors — the redis_vts collector and node registration
- Service Overview — curate session cards onto the board