Overview — what it does
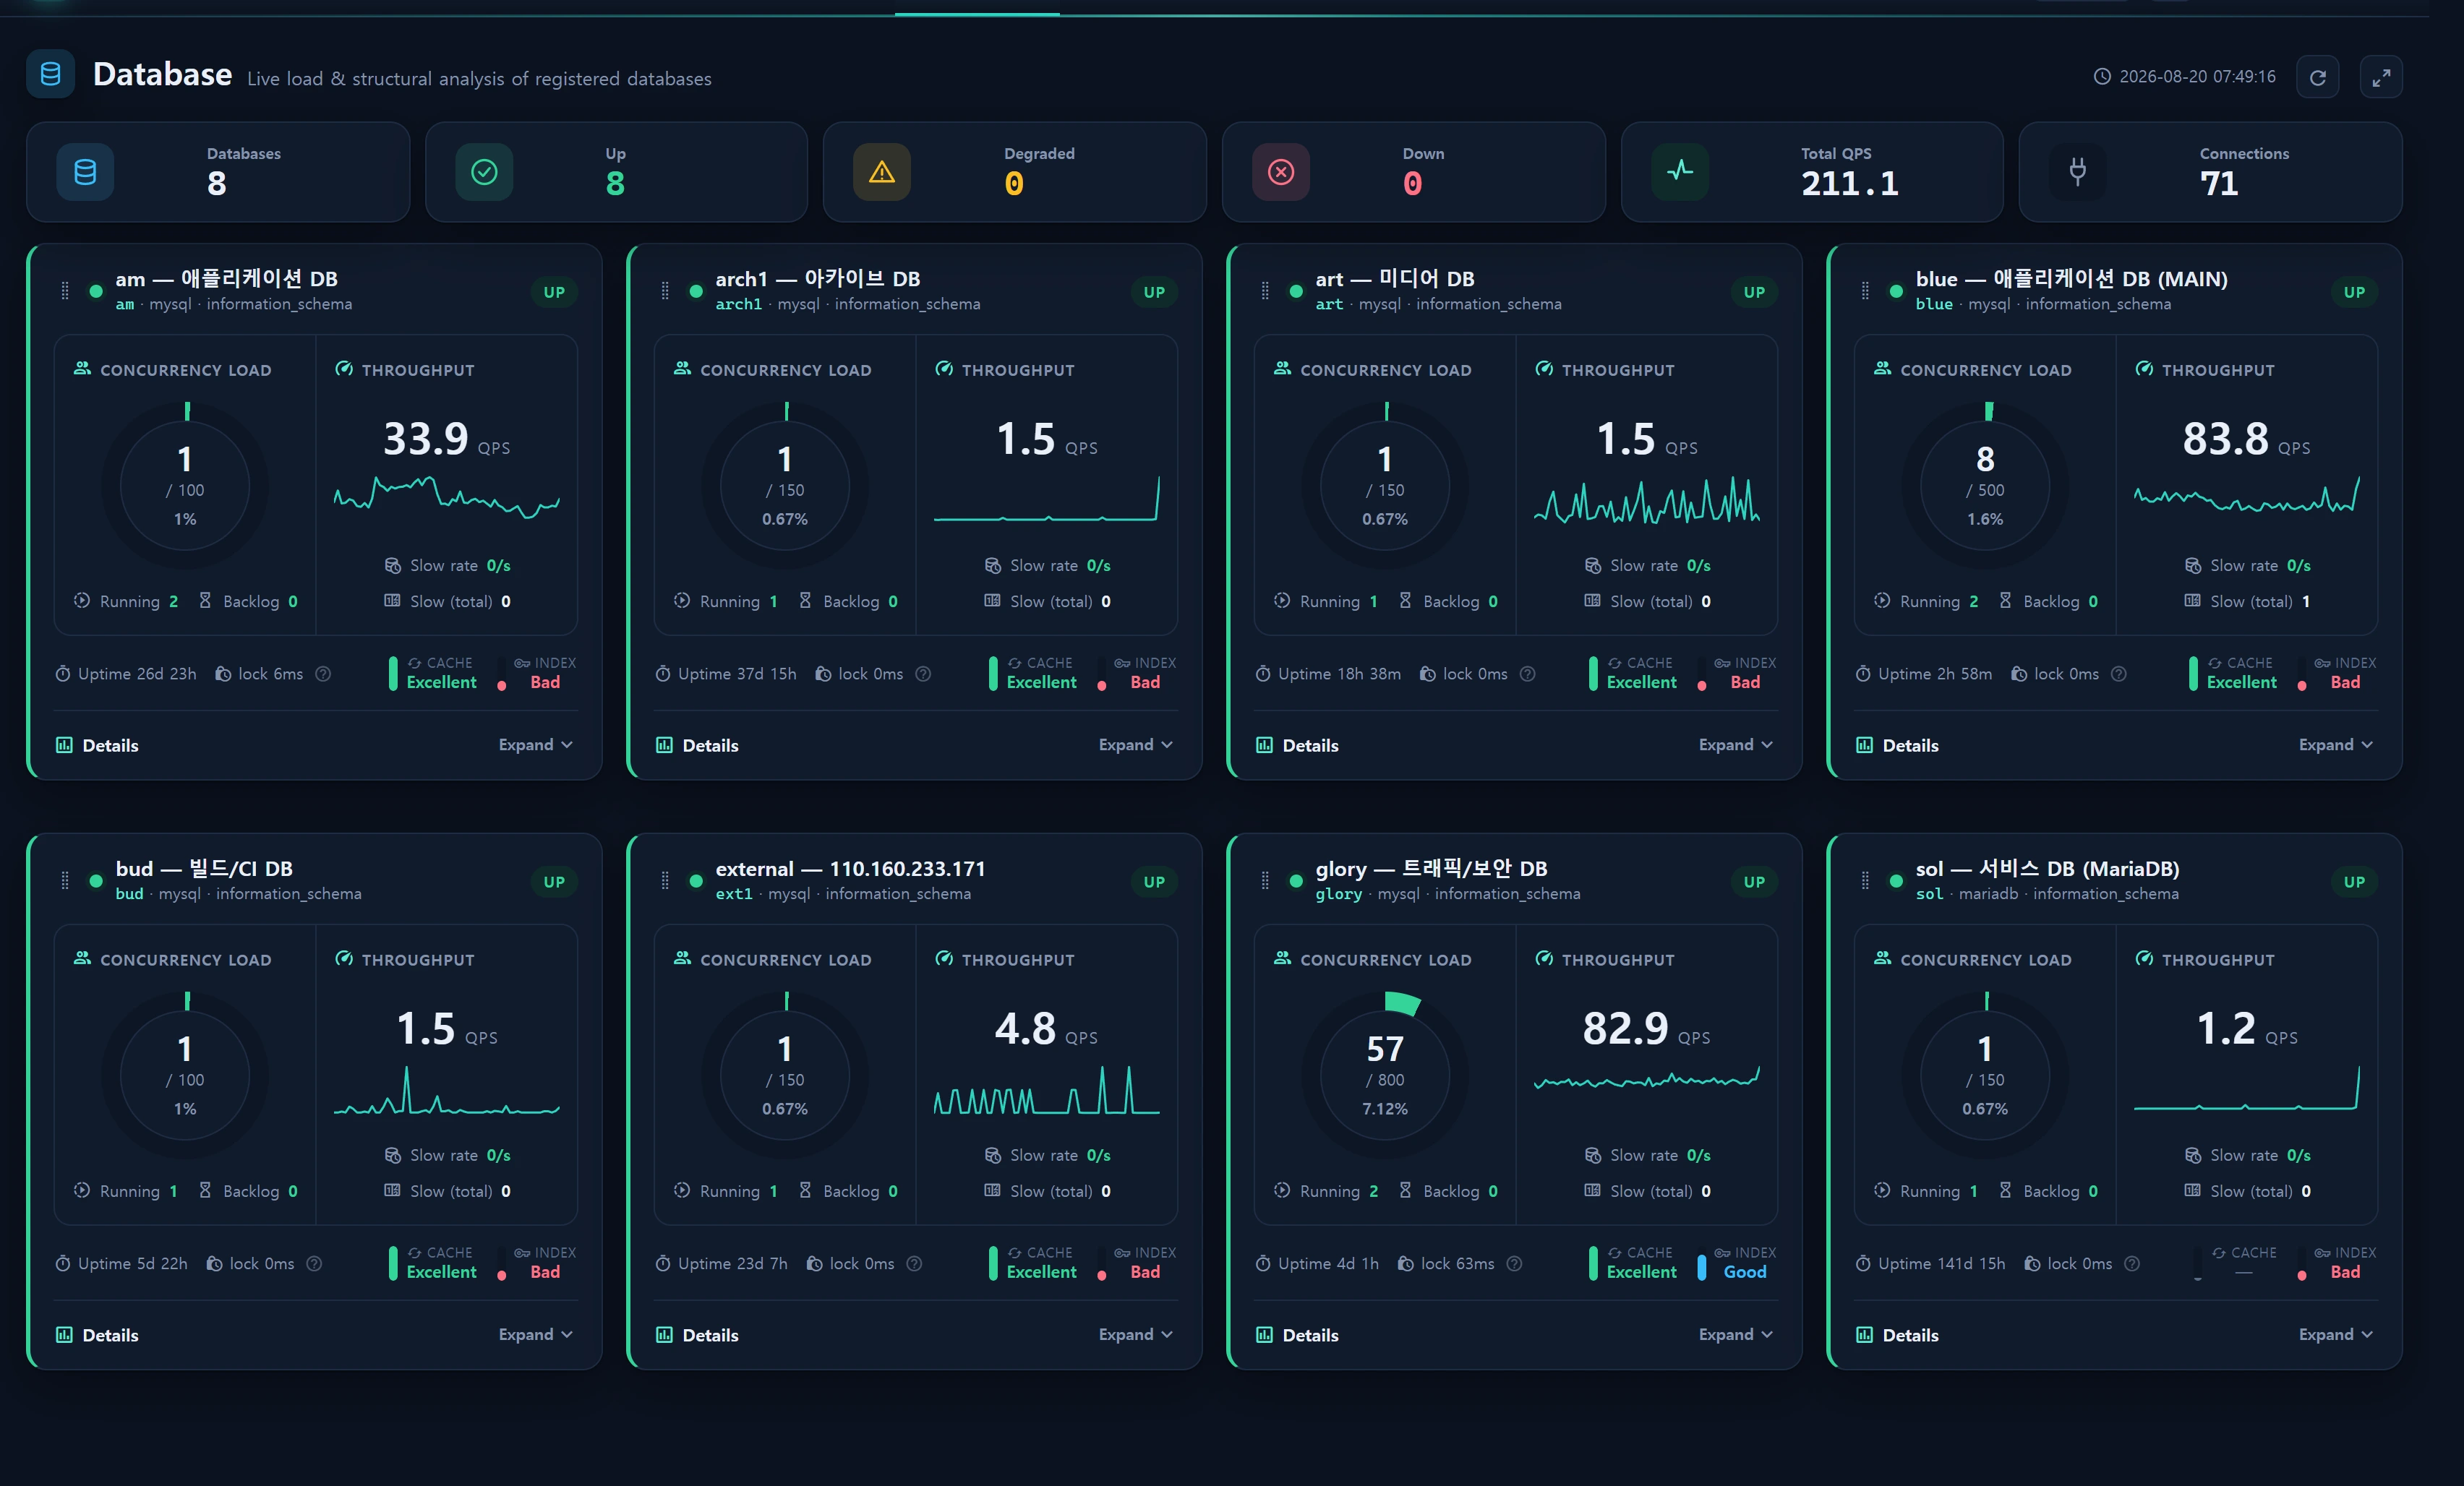
Service ▸ Database connects directly to registered DB collectors (access=database) and surfaces live load and structural metrics. Rather than just listing numbers, it attaches a designed educational hover popover to each key metric (lock wait, cache hit ratio, index usage, checkpoint, dirty pages) so you learn "why is this value bad / how do I fix it" right where you see it.
This article summarizes the concepts those popovers teach. The full lexicon lives single-sourced in the live popovers (resources/lang/{ko,en}/dbmon.php, the edu key), so in a real situation hover over the metric to read its context-specific detail.
The screen is the monitor (what is bad now), the popover is the cause education (why / how), and the actual config snapshot lives in instance parameters ([param] · nginx / my.cnf / sysctl). Read all three together to go from diagnosis → evidence → action.
When to use
- A DB card shows Degraded or Down and you want to understand the reason (connection saturation, high concurrency, query backlog, rising slow-query rate).
- The cache hit ratio or index usage score is low and you want the root cause and the improvement levers (buffer-pool size, adding indexes, covering indexes).
- Row-lock wait spikes and you need to narrow down which query/pattern is creating contention.
- The memory management detail shows dirty pages / checkpoint waveforms creeping into the risk zone and you want a tuning direction (larger buffer pool / redo log).
- DBA / DevOps onboarding — learn InnoDB internals (locks, buffer pool, redo) against real data.
Layout
Where the educational popovers attach:
| Location | Metric | What the popover teaches |
|---|---|---|
Card foot right · Cache badge |
Cache hit ratio (buffer pool) | The derivation formula + 4 ways to raise it |
Card foot right · Index badge |
Index usage | The derivation formula + 5 ways to raise index hits |
Concurrency load · lock |
Row-lock avg wait (ms) | The 7 causes of rising lock wait (by frequency) |
Header / memory detail · Checkpoint … % of redo |
Checkpoint age | What redo-log pressure means and how to read rise/fall |
| Detail (collapsible) · Memory management | Dirty pages · checkpoint time-series | LWM/MAX threshold overlay + flush-episode annotations |
The card body itself summarizes two load axes:
- Concurrency load — connection saturation (ring gauge) ·
Running(threads_running) ·Backlog(waiting) ·lock. - Throughput —
Total QPSspark ·Slow rate(slow_qps) ·Slow (total).
The bottom Schema analysis (collapsible) shows total size, top schemas, largest tables, and engine mix (separate from tuning concepts, from information_schema).
How to use
- On a DB card, find the problem metric (red/yellow badge or a high value).
- Hover over that metric's label/badge to open the context popover — cause, formula, and how-to appear.
- Expand Details to inspect the memory-management time-series with the dirty/checkpoint waveforms and threshold cut-lines.
- Apply the config lever the popover points to (e.g.
innodb_buffer_pool_size, add an index) on the target DB, or cross-check against the current value in instance parameters.
Below is a summary reference of each concept (the live popover is authoritative).
Row-lock wait — 7 causes
Average time InnoDB waited to acquire a row lock (ms). Higher = more contention. By frequency:
| # | Cause | Gist |
|---|---|---|
| 1 | Transactions holding locks too long | After BEGIN … UPDATE …, a late commit (external API, user think-time, a slow query) queues every transaction waiting on that row. Most common. |
| 2 | Hot-row contention | Many transactions updating the SAME row (counter, stock, summary/rollup row, sequence) → serializes, waits pile up. |
| 3 | UPDATE/DELETE without an index | If the WHERE can't use an index, InnoDB locks far more rows/ranges than needed → blocks unrelated transactions. The hidden #1 in practice. |
| 4 | Gap / next-key locks | Under REPEATABLE READ, range locks also lock the gaps between rows, blocking INSERTs. Range UPDATE + concurrent INSERT pattern. |
| 5 | Large batch DML | A single UPDATE/DELETE touching tens of thousands of rows holds many locks for a long time. |
| 6 | Slow lock holder | If the lock-holding query is slow on I/O or CPU it keeps the locks longer — rising slow-query rate and rising lock waits move together. |
| 7 | Foreign-key checks | Updating an FK-referencing table takes shared locks on parent rows, adding to the wait. |
On this screen, #3 (UPDATE without an index) is the hidden #1 driver of lock-wait spikes. Read the TRANSACTIONS section of
SHOW ENGINE INNODB STATUStogether with the index usage score.
Cache hit ratio (InnoDB buffer pool)
High when most reads are served from memory (the buffer pool) rather than disk.
hit ratio = 1 − Δinnodb_buffer_pool_reads / Δinnodb_buffer_pool_read_requests
| Grade | Threshold |
|---|---|
| Excellent | ≥ 99.5% |
| Good | ≥ 98% |
| Fair | ≥ 90% |
How to raise it (summary): grow innodb_buffer_pool_size (50–75% of RAM rule of thumb) · reduce full scans to avoid polluting the buffer pool · shrink the working set (avoid unused columns, split large BLOBs, archive) · use innodb_buffer_pool_instances to cut contention + dump/reload the buffer pool on restart.
Index usage
Ratio of reads that found rows via an index vs reads that scanned to the next row.
index usage = Δhandler_read_key / (Δhandler_read_key + Δhandler_read_rnd_next)
| Grade | Threshold |
|---|---|
| Excellent | ≥ 90% |
| Good | ≥ 70% |
| Fair | ≥ 40% |
How to raise it (summary): use EXPLAIN to find full scans (type=ALL) and filesorts, then index the WHERE/JOIN/ORDER BY columns · build composite indexes most-selective-column-first (left-prefix rule) · don't defeat indexes with functions/casts on the column (WHERE DATE(col)=… → use a range) · use covering indexes · drop duplicate/unused indexes.
Checkpoint age (redo-log pressure)
How far the redo log advanced past the last checkpoint (bytes) = the changes not yet flushed to the data files, and the work InnoDB would replay on a crash. The header's % of redo is the distance to the flush-storm cliff.
| State | % of redo | Meaning |
|---|---|---|
| Safe | < 50% | Changes flushed in time |
| Watch | 50 – 75% | Writes outpacing flushing; forced flush getting closer |
| Risk | ≥ 75% | Near async/sync flush threshold — forced flush risks latency / I/O storms |
Reading it: rising = writes > flush (redo filling) · falling = flush caught up (healthy) · sawtooth = accumulate ↔ flush, a normal rhythm. Near 75%, consider a larger buffer pool / innodb_log_file_size.
Dirty-page flush (memory management)
Pages in the buffer pool changed but not yet written to disk. The appropriate value is the server's own flush thresholds (innodb_max_dirty_pages_pct = MAX, innodb_max_dirty_pages_pct_lwm = LWM). Experts: dirty pages should oscillate below the LWM.
| State | Condition | Meaning |
|---|---|---|
| Healthy (good) | Oscillates below threshold (healthy sawtooth) | The DB is not suffering during flushes |
| Caution (warn) | Above the low-water mark (pre-flush zone) | Watch write pressure and checkpoint lag |
| At risk (crit) | Reached the MAX threshold | Aggressive flush → latency spikes / I/O storms (grow buffer pool / redo log) |
The memory-management time-series overlays the LWM/MAX cut-lines on top of dirty pages and pins eviction/flush episodes. The right-side metrics also show Pending writes and Row-lock avg.
Data sources
The real counters and storage the education concepts reference:
| Concept | Source counter / state | Note |
|---|---|---|
| Lock wait | SHOW GLOBAL STATUS · information_schema.processlist |
Computes backlog; needs PROCESS privilege |
| Cache hit ratio | Innodb_buffer_pool_reads / _read_requests |
Delta between samples |
| Index usage | Handler_read_key / Handler_read_rnd_next |
Delta between samples |
| Checkpoint · dirty | InnoDB status (checkpoint age · dirty pages · pending) | Memory-management time-series |
| QPS · slow | Questions · Slow_queries (cumulative) |
Delta → QPS / slow rate derived |
- The time-series is stored in
infr_db_metric(migration 000681).App\Services\Database\DbCollectorServiceconnects directly to the registered DB, readsSHOW GLOBAL STATUS+@@max_connections+ processlist, and computes the derived metrics as the delta from the previous sample. - Collection runs via the
infr:collect-dbcommand (scheduled every minute by default, one-shot exit). On page entry, if the last sample is stale,ensureFresh()takes an immediate one-off sample. - Screen poll interval: 30s. To avoid connection leaks the collector uses
DB::purgeinfinallyplus a PDO timeout.
Card status (degraded) thresholds (OpsPolicy::dbThresholds() defaults — tune in Operations Policy):
| Condition | Default threshold | Reason label |
|---|---|---|
Connection saturation conn_pct ≥ |
80% | connection saturation |
threads_running ≥ |
40 | high concurrency |
waiting (backlog) ≥ |
5 | query backlog |
slow_qps ≥ |
1/s | slow-query rate |
Access
- Read (view screen & popovers): demo (level 1) and up. Popovers are pure educational content — no extra gating or audit.
- Adjust DB status thresholds: managed in Operations Policy — admin (level 5/10 ·
infr.level:N). - Register/edit DB collectors: Collectors admin (level 5/10). Passwords are stored encrypted (Crypt) in the collector, or reuse a
.envcredential set viacred_ref = env:PREFIX(never hardcoded).
Troubleshooting & FAQ
Q. Backlog shows "own connections only".
Counting server-wide backlogged queries requires the PROCESS privilege on the DB account. Without it, only your own connections are counted. See sql/infr_db_monitor_grant.sql (a dedicated monitoring account is recommended).
Q. Cache/index scores are blank (N/A). Derived metrics are computed as the delta between two samples. If the collector just started or the counters reset (a restart), the first sample yields no score — wait for the next cycle.
Q. A card shows stale (no recent sample).
In economy mode, collection is skipped when no console user is present. On entry, ensureFresh(45s) takes an immediate sample, but if the scheduler is backed up the card may briefly downgrade to pending. For always-on collection, set the DB collect mode to always in Operations Policy.
Q. How do I translate/edit the popover text?
The education lexicon lives in a single place: the edu key of resources/lang/{ko,en}/dbmon.php (single-sourced). Other locales fall back to en.
Q. How do I actually narrow down a lock-wait cause?
On the target DB, inspect SHOW ENGINE INNODB STATUS (TRANSACTIONS · LATEST DETECTED DEADLOCK) and information_schema.INNODB_TRX / data_locks, and cross-check against the 7-cause table above.
Related
- Service ▸ Database — the live load & structure screen where these concepts appear
- Redis tuning concepts — the counterpart education popovers for Sessions (Redis): memory capacity, hit ratio, fragmentation
- DB collectors — the direct-connect collection pipeline for registered DBs
- Operations Policy — tune DB status thresholds and collection mode
- Instance parameters — the actual tuning-value snapshot (my.cnf etc.), the AI-tuning evidence